
Area : Bangladesh
Client : JAXA
Start Year : April 2008
End Year : March 2009
Partners : –

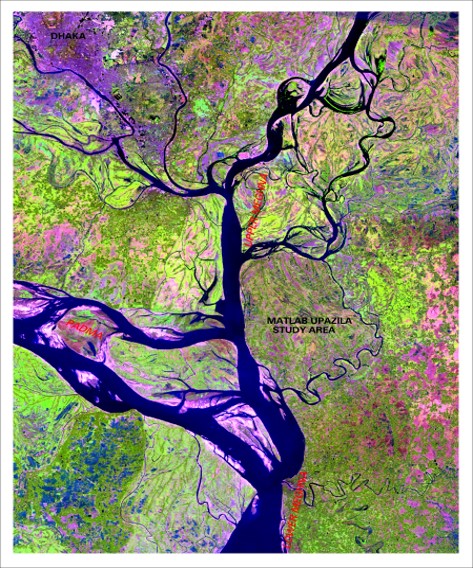
Flood Damage Assessment and Flood Map Improvement in Matlab Upazilla - A Case Study at Chandpur, Bangladesh
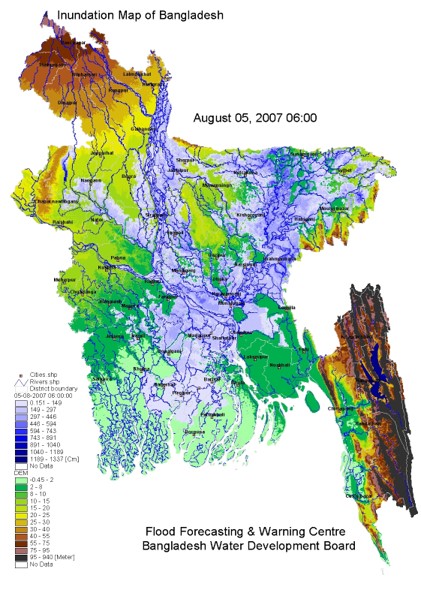
The objectives of this project were: 1) To prepare a flood map corresponding to 2007 flood event, 2) To develop flood damage curves for households based on 2007 flood event, 3) To develop a model in GIS for rapid flood damage assessment.
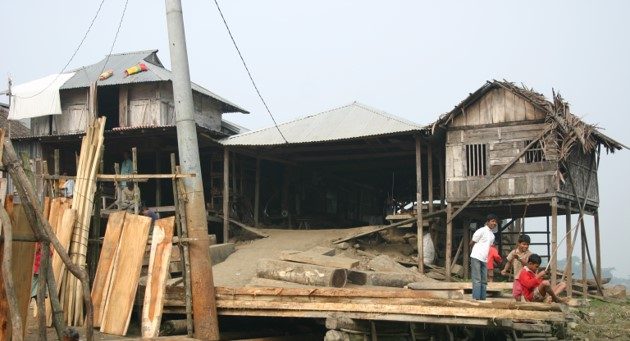
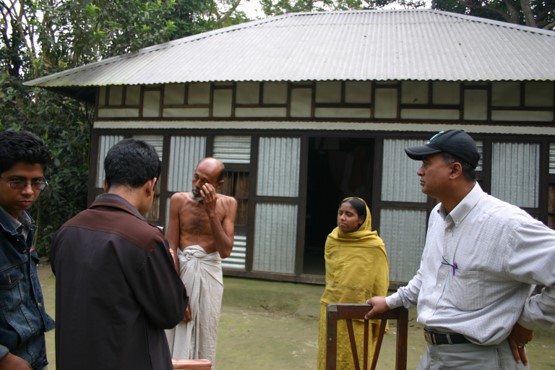
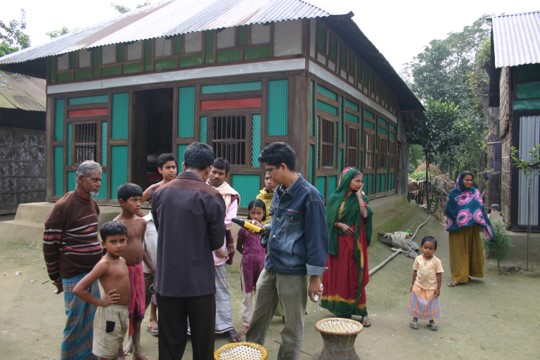
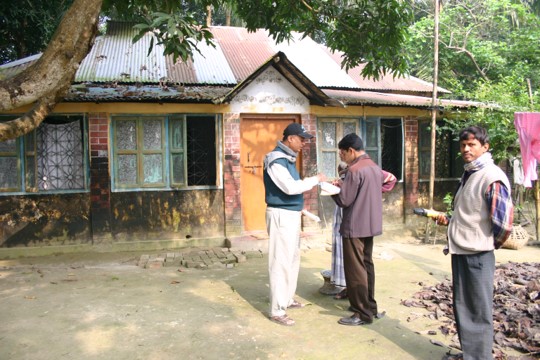
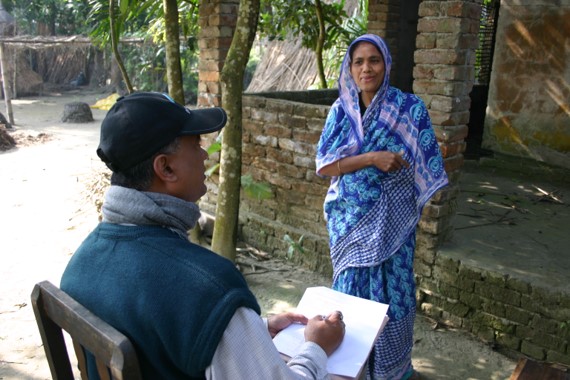
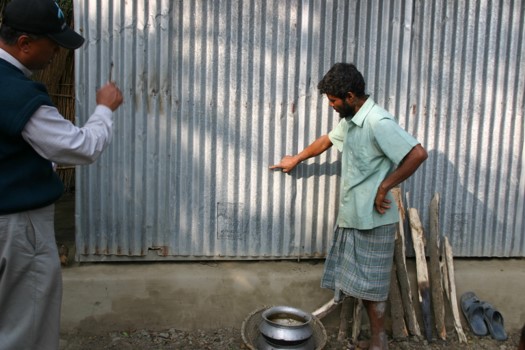
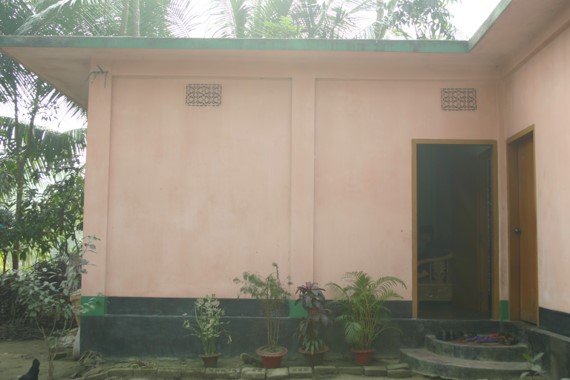
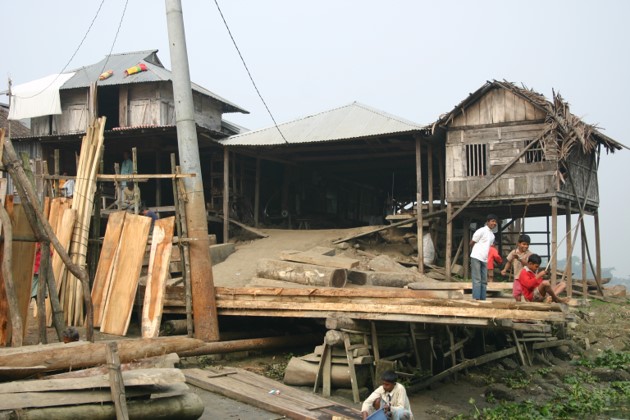
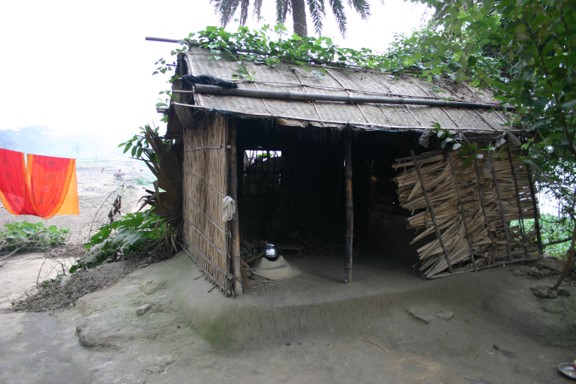
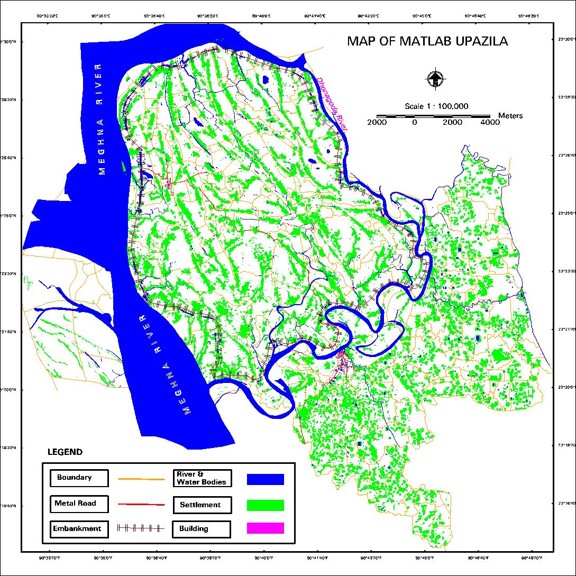
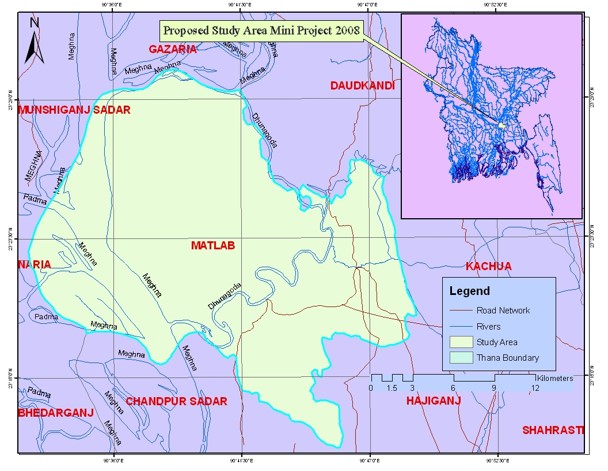
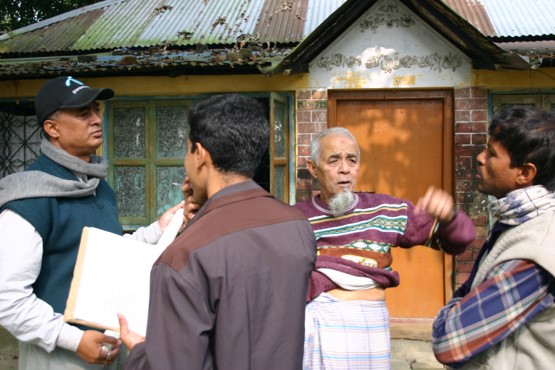
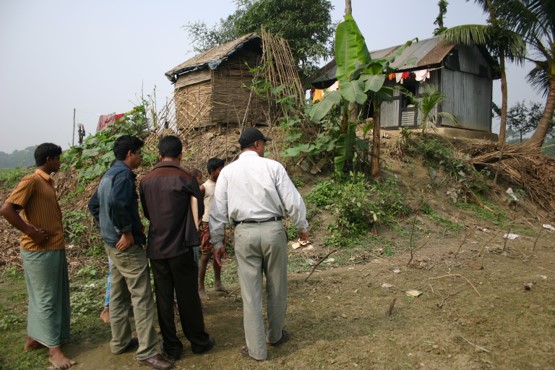
The study area, Matlab Upazila (sub-district) of Chandpur district is situated just below the Padma-Meghna confluence where the combined discharge of two major rivers (Ganges and Brahmaputra) makes its way out and leaving the area highly vulnerable to flooding. A questionnaire was designed for collecting necessary information for developing flood damage curves for different household types in the study area. A field visit was conducted in December 2008 by sampling 63 houses and regression analyses was performed to develop damage curves for selected household types, namely CI sheet houses, RCC houses, brick masonry houses, wooden houses, and earthen houses. A raster model was developed for rapid damage assessment, based on the landuse information. The thematic layers (vector) such as settlement areas, urban areas, river, canal, pond, and agriculture were created from the aerial photographs acquired in 2005. ALOS/AVNIR-2 data of the year 2007 was then used to update the landuse/landcover map. The produced vector themes were then rasterized at a pixel size of 100 m by 100 m. A parallel raster data set was created with an attribute of possible maximum damage per pixel according to the landuse categories to create a maximum cell damage-cost map. A flood map of the area giving the flood extent and depth was obtained from hydrologic simulations using the MIKE-11 model with necessary resampling of the original grid. The flood depth at each cell location was obtained from the flood map which was then assigned a damage factor from the damage curves developed for the area. This damage factor map was multiplied by the max cell damage-cost map to obtain the total damage-cost by summing up the values of each cell.