Overview
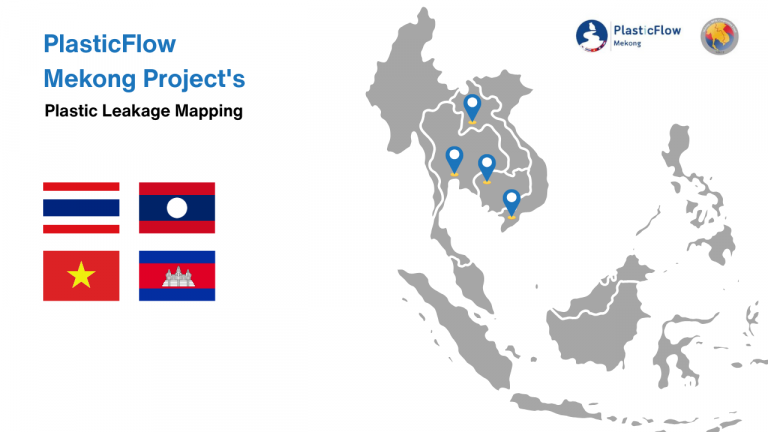
To address the growing issue of plastic pollution in rivers and waterways, the Geoinformatics Center (GIC) has developed comprehensive plastic leakage maps for four Southeast Asian cities: Bangkok (Thailand), Can Tho (Vietnam), Vientiane (Laos), and Battambang (Cambodia). This milestone is a part of the PlasticFlow Mekong project funded by the Mekong ROK Cooperation Fund. These maps provide a crucial baseline for understanding the extent of plastic waste leakage and identifying pollution hotspots in each target location. By integrating various data sources such as population density, land use, waste collection coverage, rainfall, flood patterns, and findings from ground surveys, the maps offer a holistic view of plastic leakage patterns across the project sites.
Plastic Leakage Scenario in Mekong Subregion
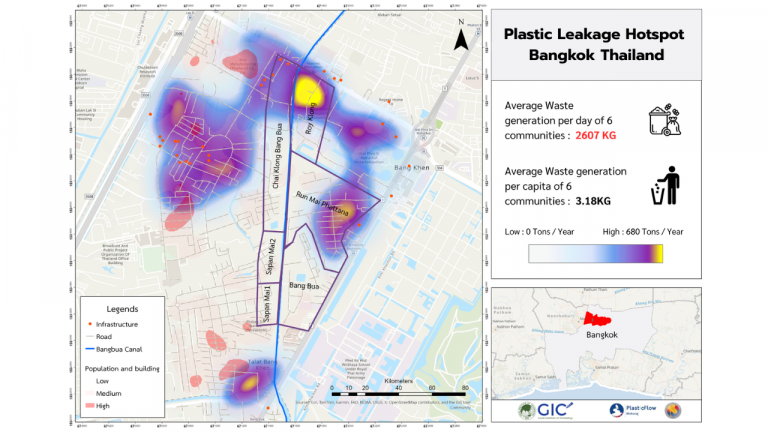
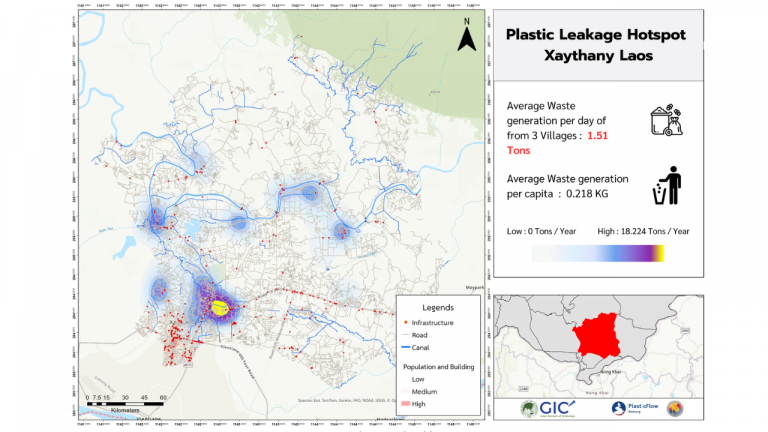
In Bangkok, Thailand, six communities along the Bang Bua Canal were surveyed, collectively producing 2.607 tons of waste daily, with an average per capita waste generation of 3.18 kg. The mapping revealed significant plastic leakage hotspots, particularly in parts of the Roy Khlong and Run Mai Phattana communities, where leakage is estimated at around 680 tons per year—the highest among all surveyed locations. In Laos, surveys were conducted in Xaythany District, covering three villages: Thasavang, TharNgon, and Phoukham. Collectively, these communities produced 1.51 tons of waste per day, with a per capita generation rate of 0.218 kg, reflecting lower overall consumption and waste production compared to urban centers in other countries.
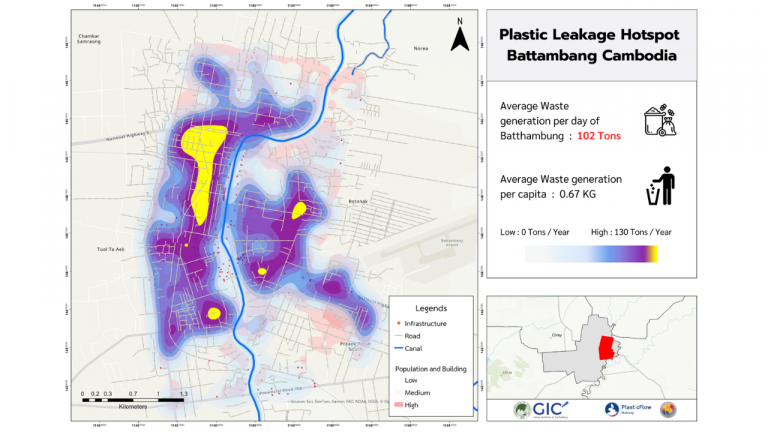
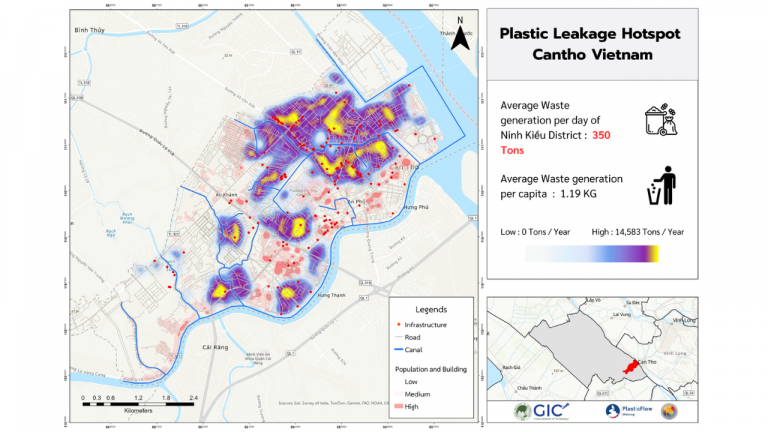
Among the four countries, Vietnam and Cambodia recorded the highest waste volumes. In Can Tho, Vietnam, the surveyed area (29.22 km²) produced approximately 350 tons of waste per day, while Battambang, Cambodia reported around 102 tons per day within a 10.9 km² area. This is likely due to the larger areas surveyed in these two locations.
These baseline maps provide a foundation for assessing the effectiveness of awareness campaigns, community training, and improved waste management systems introduced throughout the project. By the end of the initiative, updated maps will be produced to measure the impact of these interventions and track improvements in plastic leakage reduction.