
Area : The Phillippines
Client : JAXA
Start Year : April 2008
End Year : March 2009
Partners : –
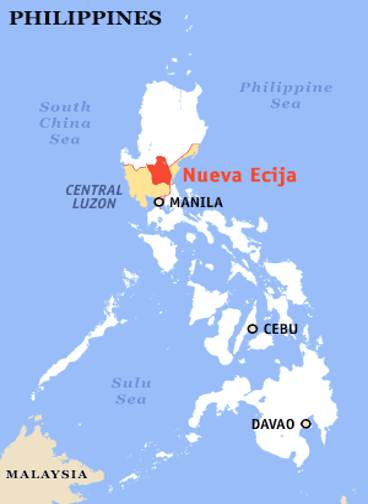

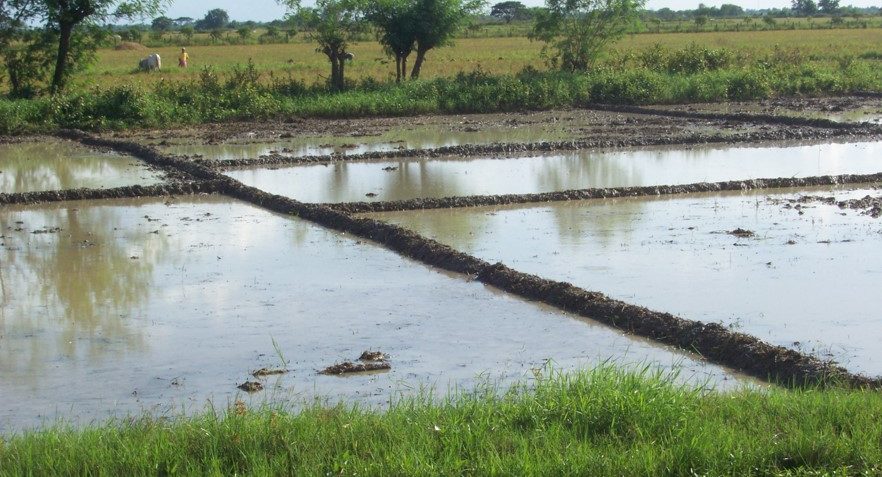
Studying the Effects of Drought on Rice Production in Nueva Ecija, Phillipines
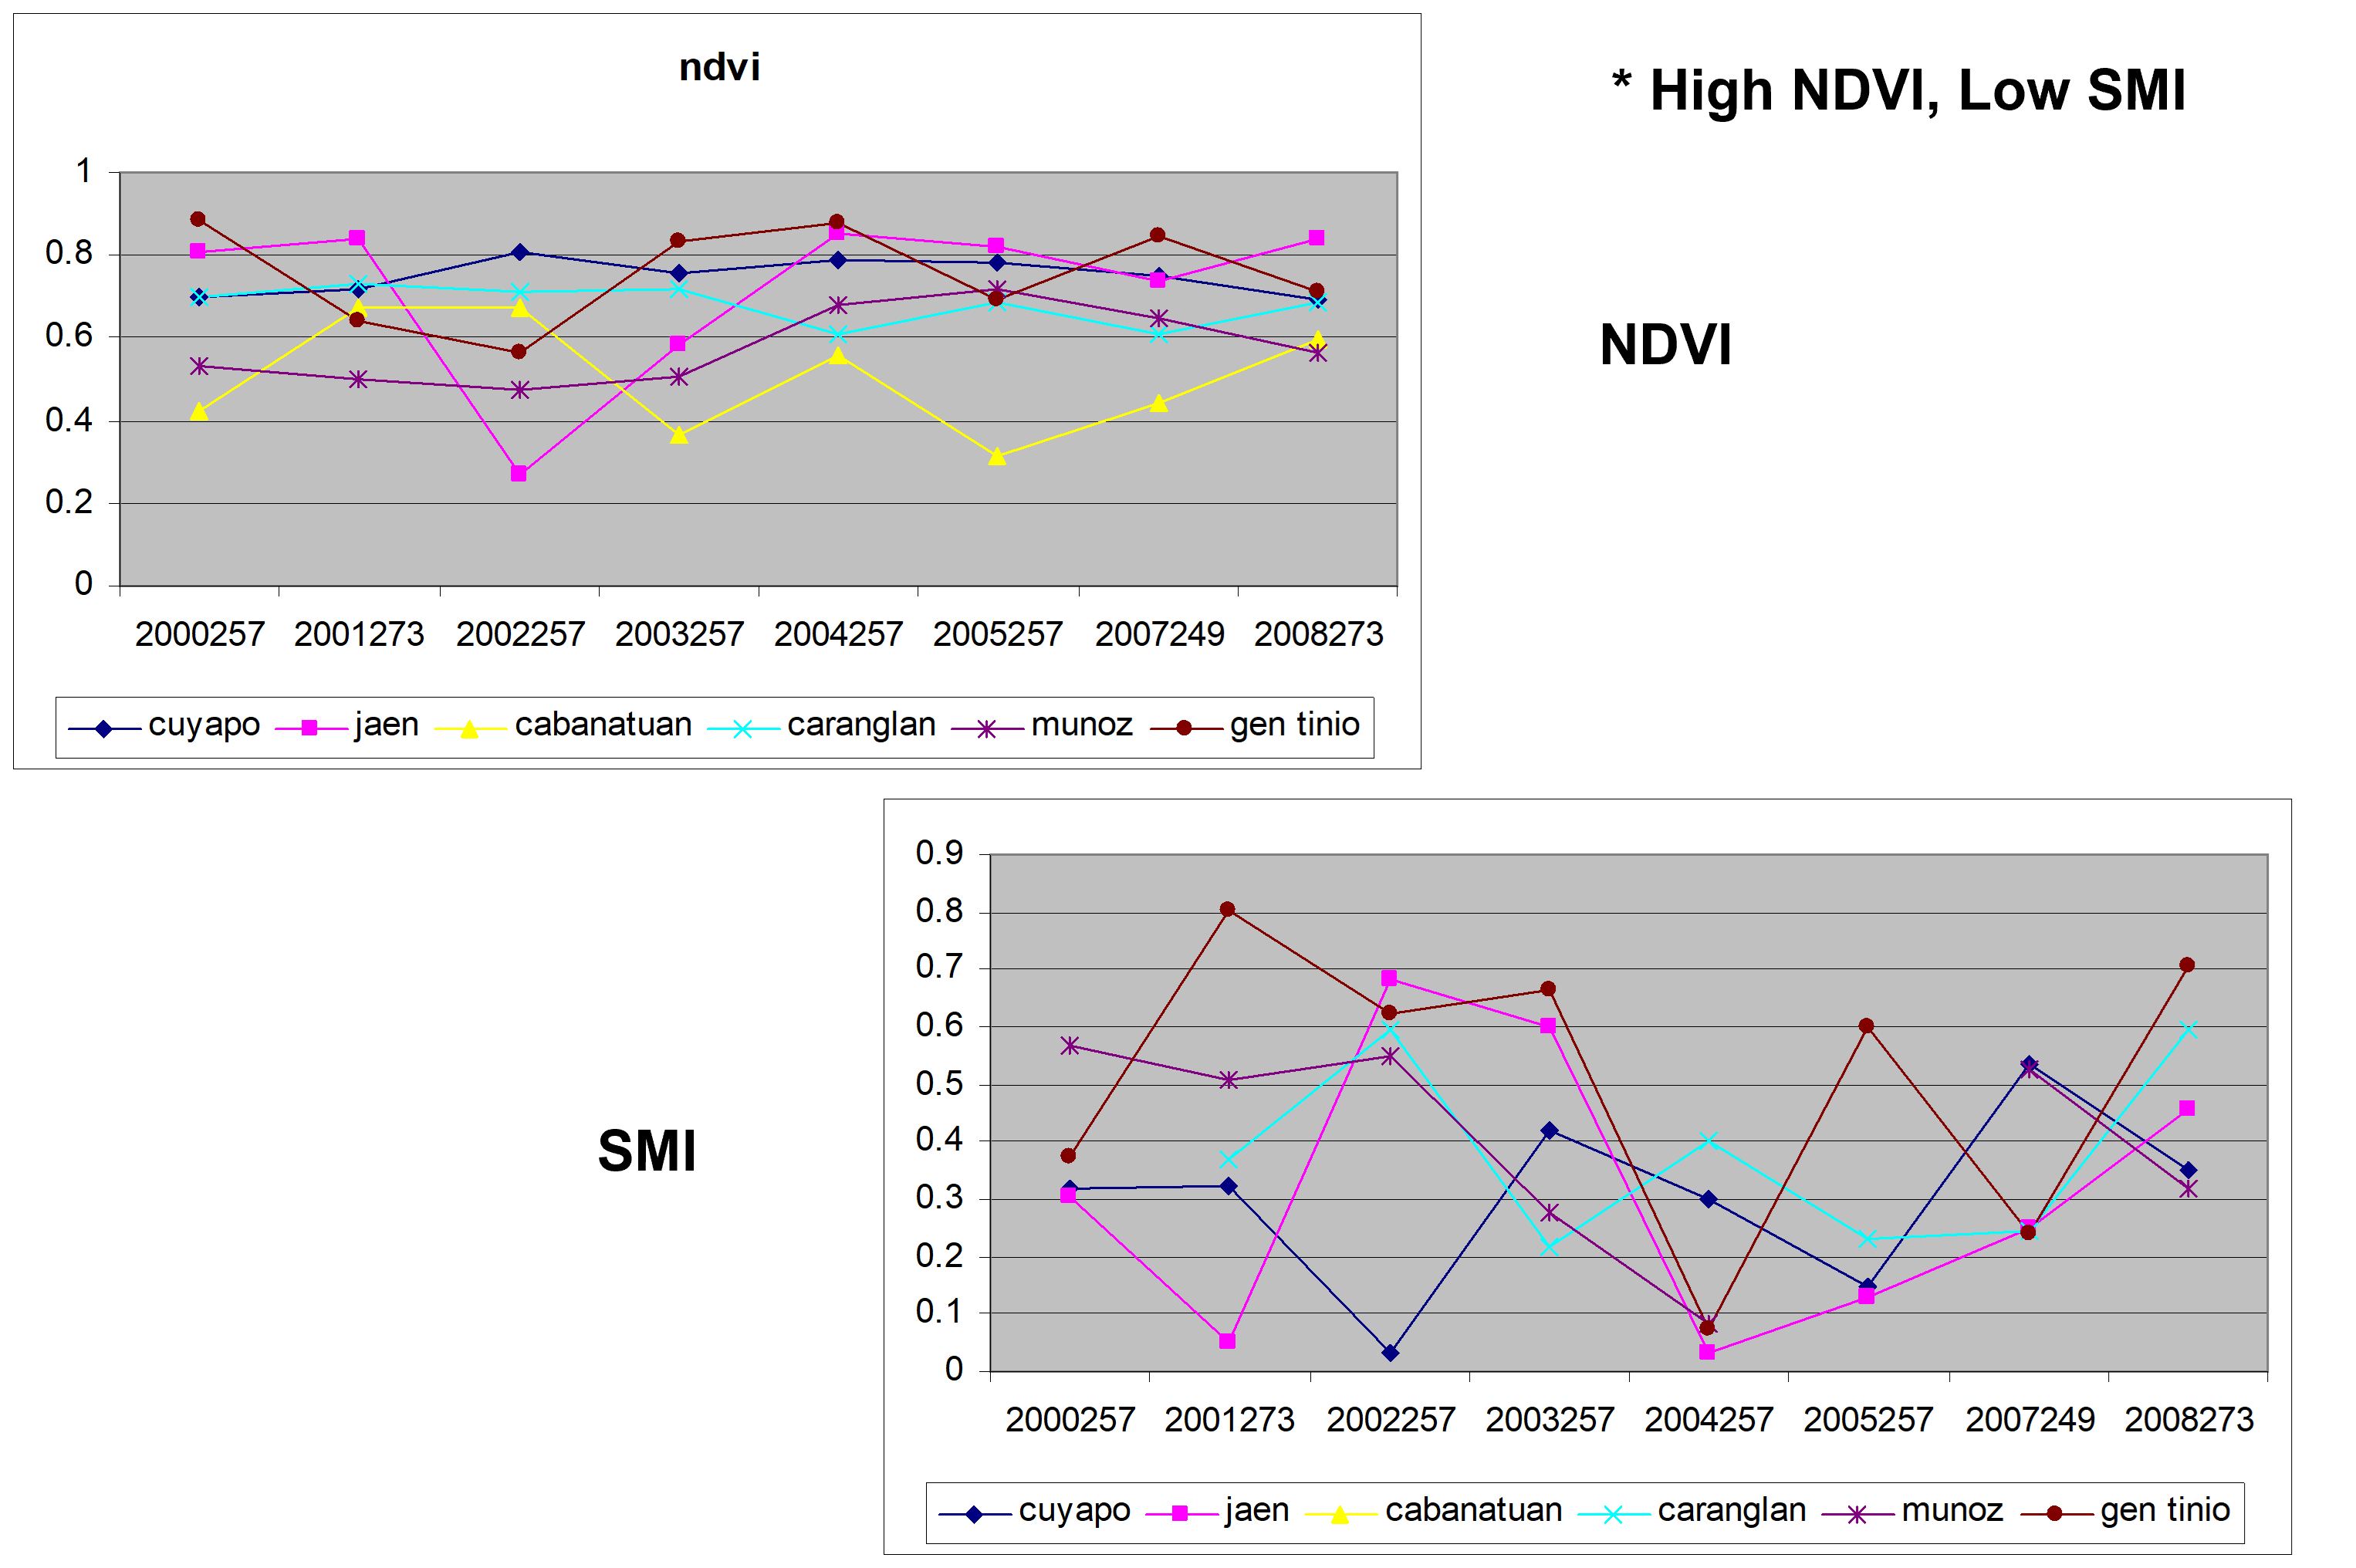
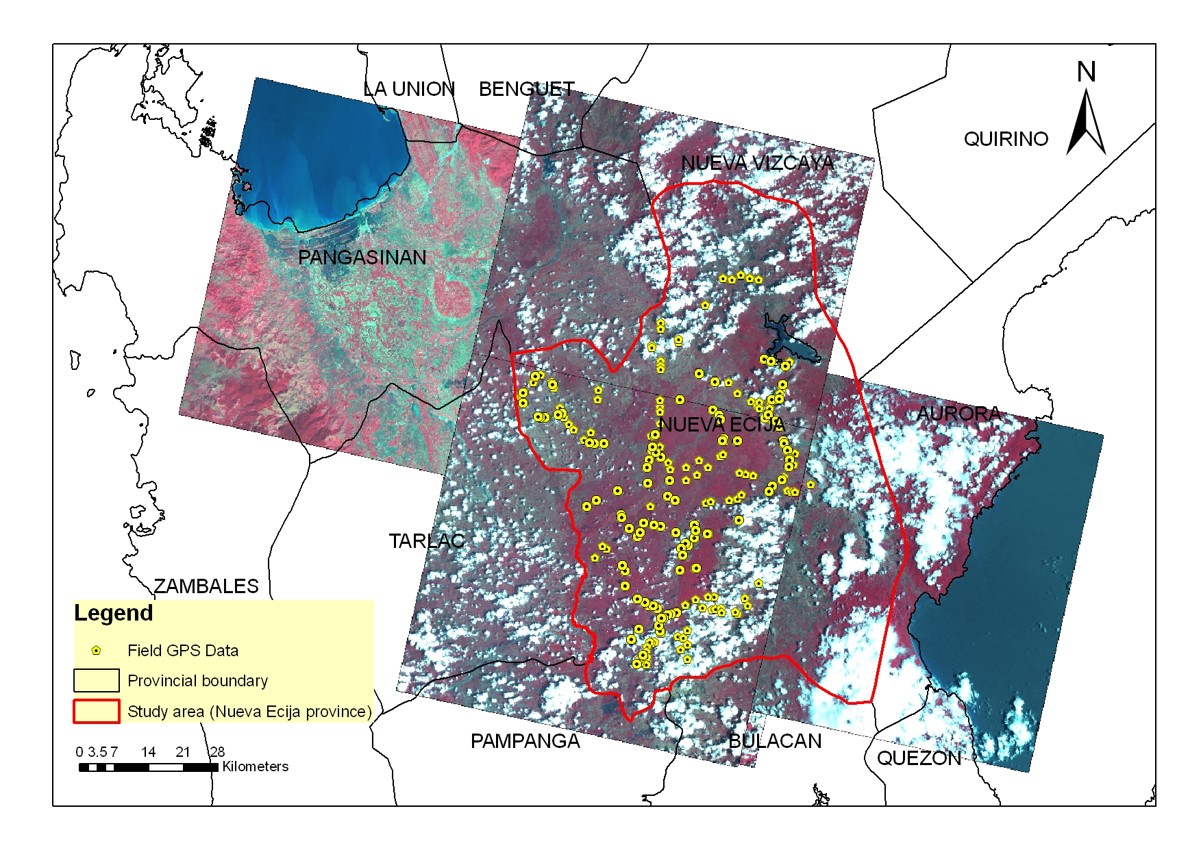
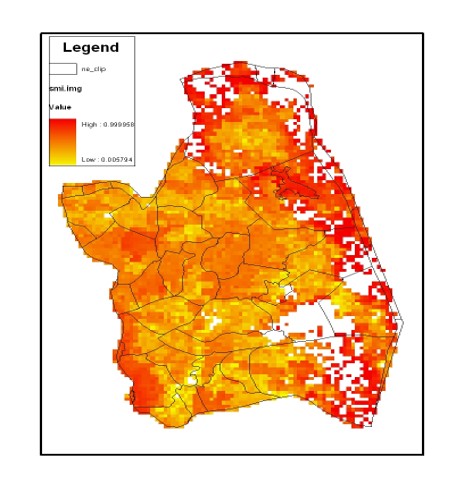
An integrated approach using remote sensing and ground meteorological observation seems to be a useful tool for detecting, monitoring and assessing drought in agricultural area, particularly in rice field area. Agricultural drought, which is defined by the deficiencies of soil moisture, is a condition wherein the availability of soil water is not enough to support crop and forage growth. Using a computationally straightforward remote sensing index, so called Soil Moisture Index (SMI), a status of soil moisture condition over period of time can be achieved. SMI derived from the 8-day composite MODIS satellite images, utilized relationship between Land Surface Temperature (LST) and Normalized Difference Vegetation Index (NDVI). September images from 8 consecutive years (2000-2008) were chosen because this period represented the critical growth stages of the rice crop, particularly the reproductive and the grain-filling periods which is more sensitive to thermal stress.. According to the SMI, the drought distribution was classified into four major groups. SMI value more than 0.3 has been classified as a no drought and SMI values less than 0.3 has been classified in three categories of drought namely severe drought (0-0.1), moderate drought (0.1-0.2) and slight drought (0.2-0.3). Among the years, 2005 showed the most intense drought condition in terms of severity and in land covered. Cuyapo, Namipicuan and Talugtug, which are mostly rainfed rice areas, were found to be more vulnerable to drought occurrence.
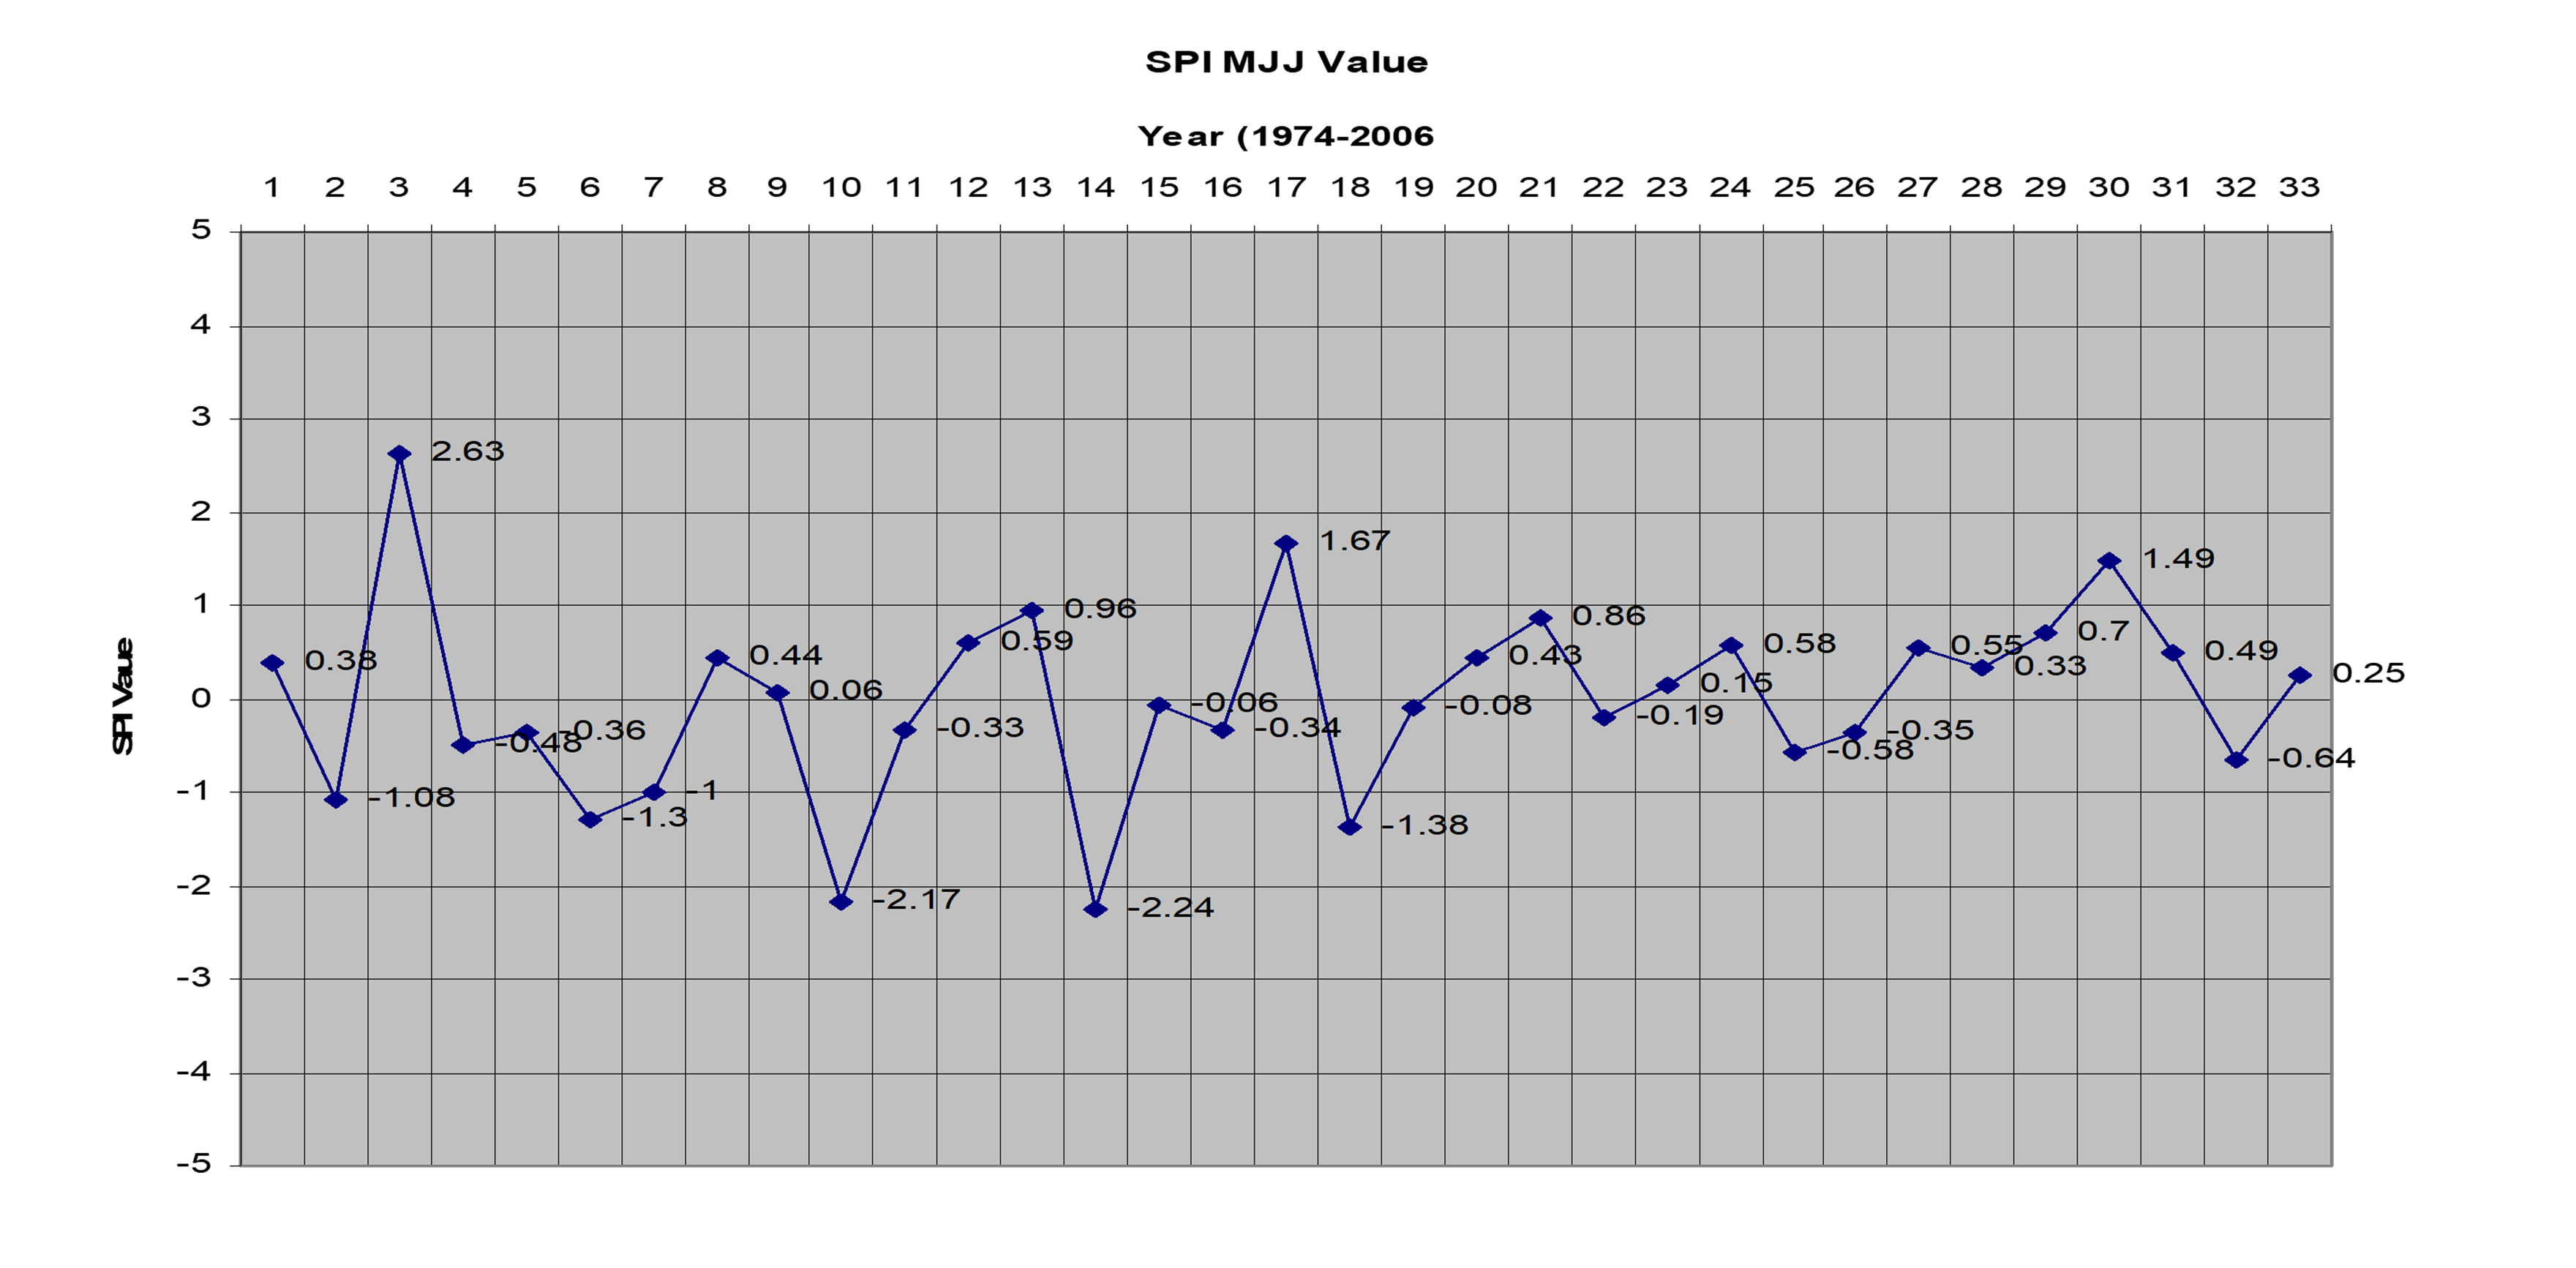
Result from SMI coincides with another index based on meteorological data, that is Standardized Precipitation Index (SPI) and Palmer Drought Severity Index (PDSI), since both indices gave a below normal value in year 2005 which indicates a drought condition. The yield indicator Pd was also crucial in the assessment of the drought impacts on rice production. Although, Pd value observed 2005 is normal but there was a decrease as compared to the previous and following years.
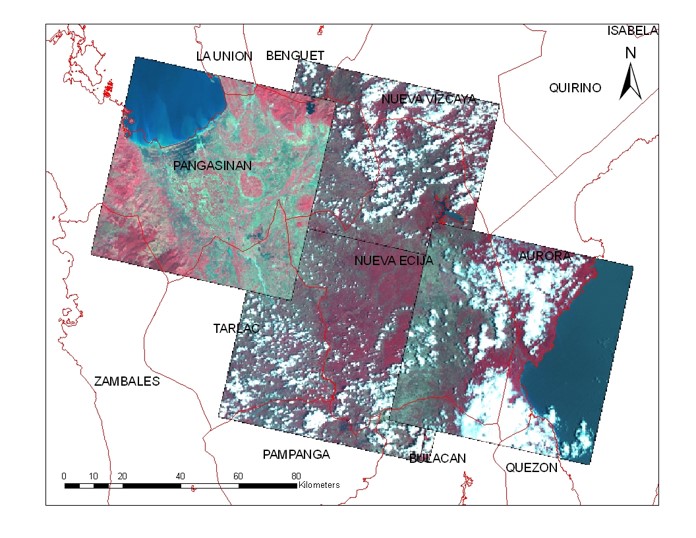
Land use map of Nueva Ecija, was prepared from ALOS/AVNIR-2 image acquired on April 27th, 2007 and March 31th, 2008. It was classified into 5 classes from originally 20 classes of unsupervised classification referring to ground check data and past land use map, namely built-up, rice, water, forest/grass/cops, cloud/cloud shadow.