
Area : Mongolia
Client : JAXA
Start Year : April 2008
End Year : March 2009
Partners : –
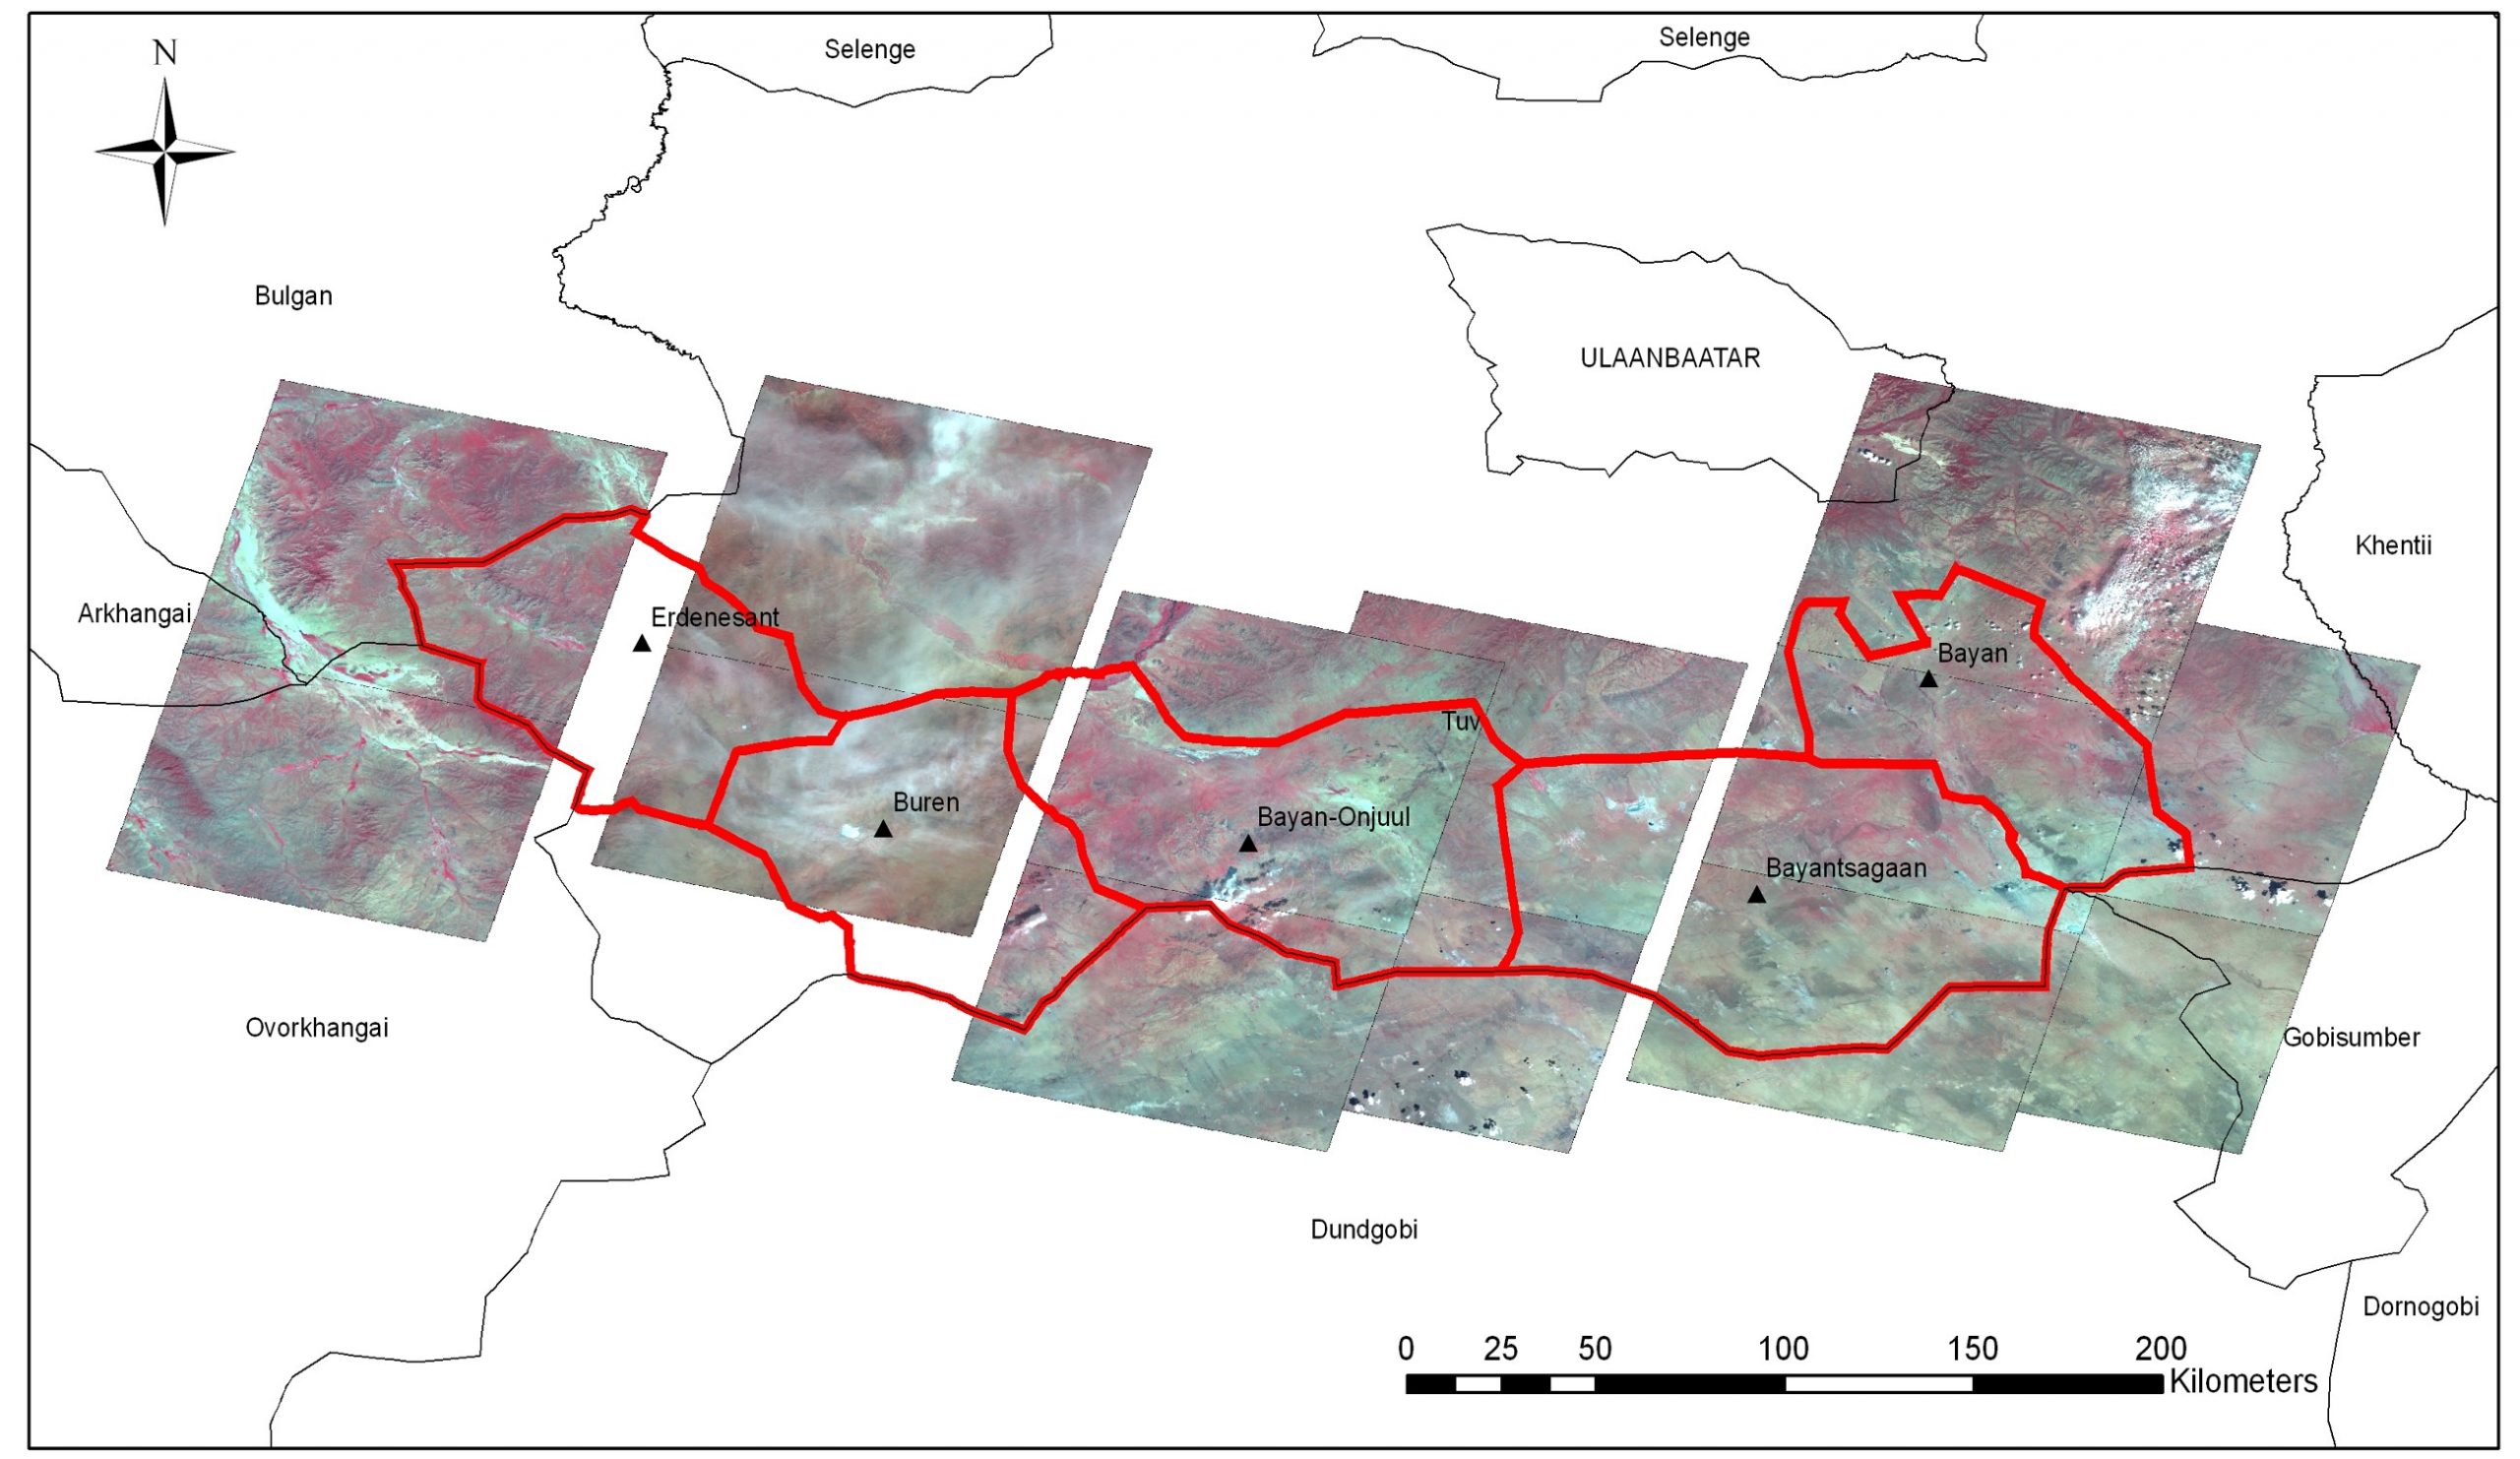
Drought Monitoring using MODIS and Meteorological Data (A Case Study of Tuv Aimag, Mongolia)
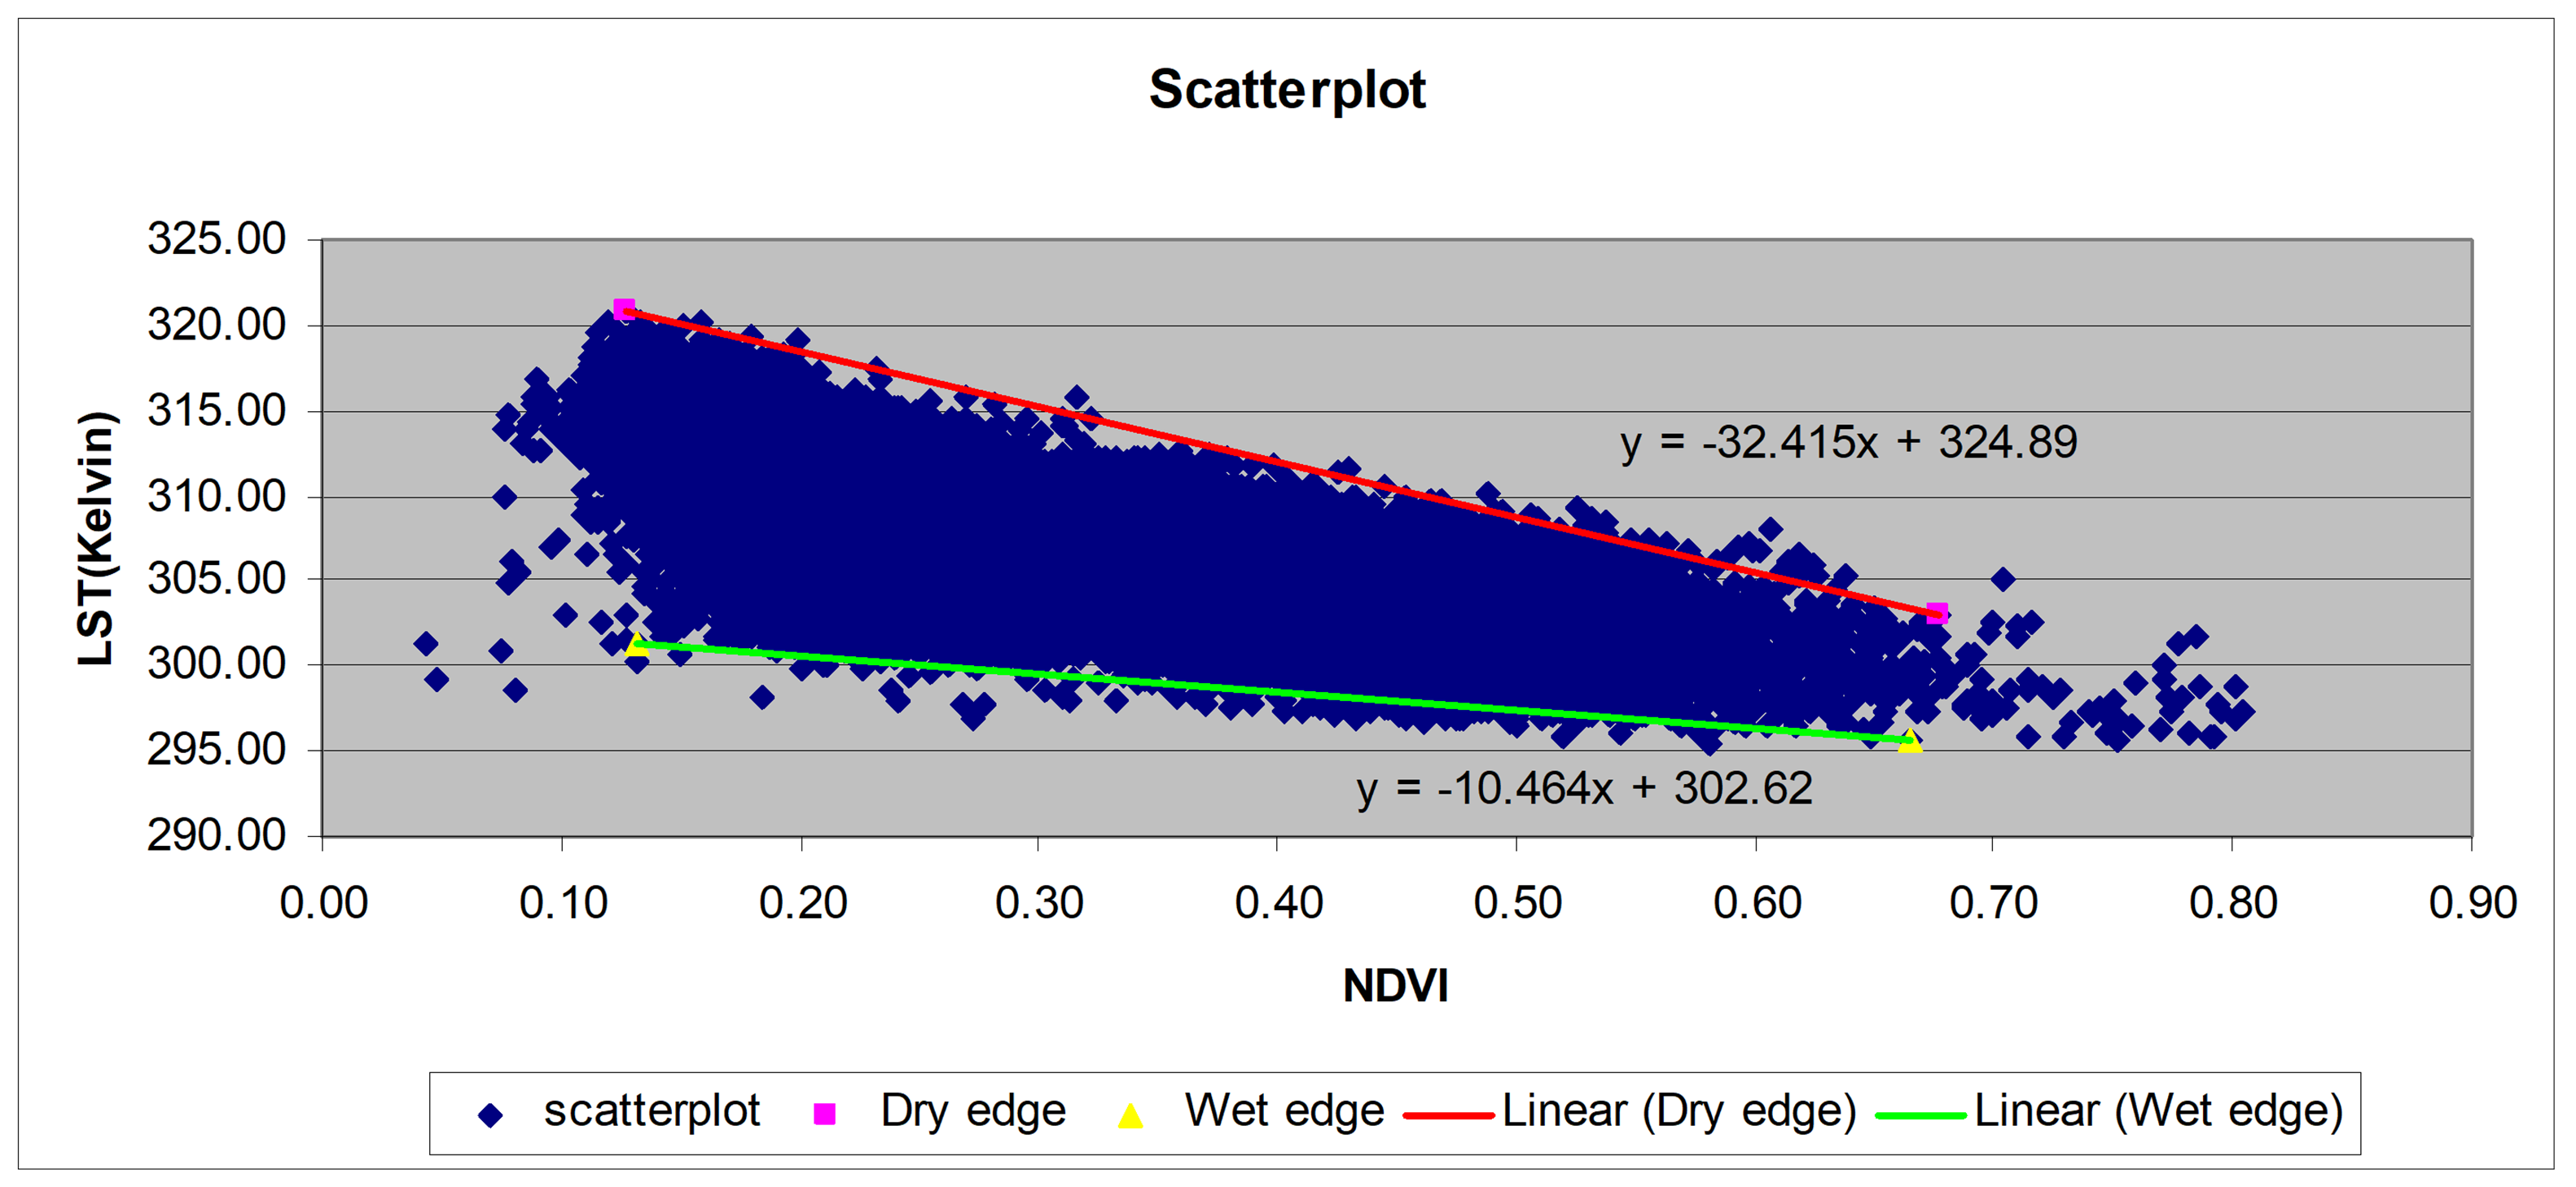
In this study, potential use of remote sensing for drought detection, mapping and monitoring in Tuv Aimag, Mongolia were investigated. Using an empirical parameterization index, so called Soil Moisture Index (SMI), multi-temporal drought severity maps were obtained. SMI is related to soil moisture condition and therefore could be used as a promising tool for drought study. MODIS 8-days composite products such as MOD09 (Surface Reflectance) and MOD11 (Land Surface Temperature) were used to derive SMI. Total of 70 SMI images in dry season from 8 consecutive years (2000-2008) were processed for monitoring purpose.
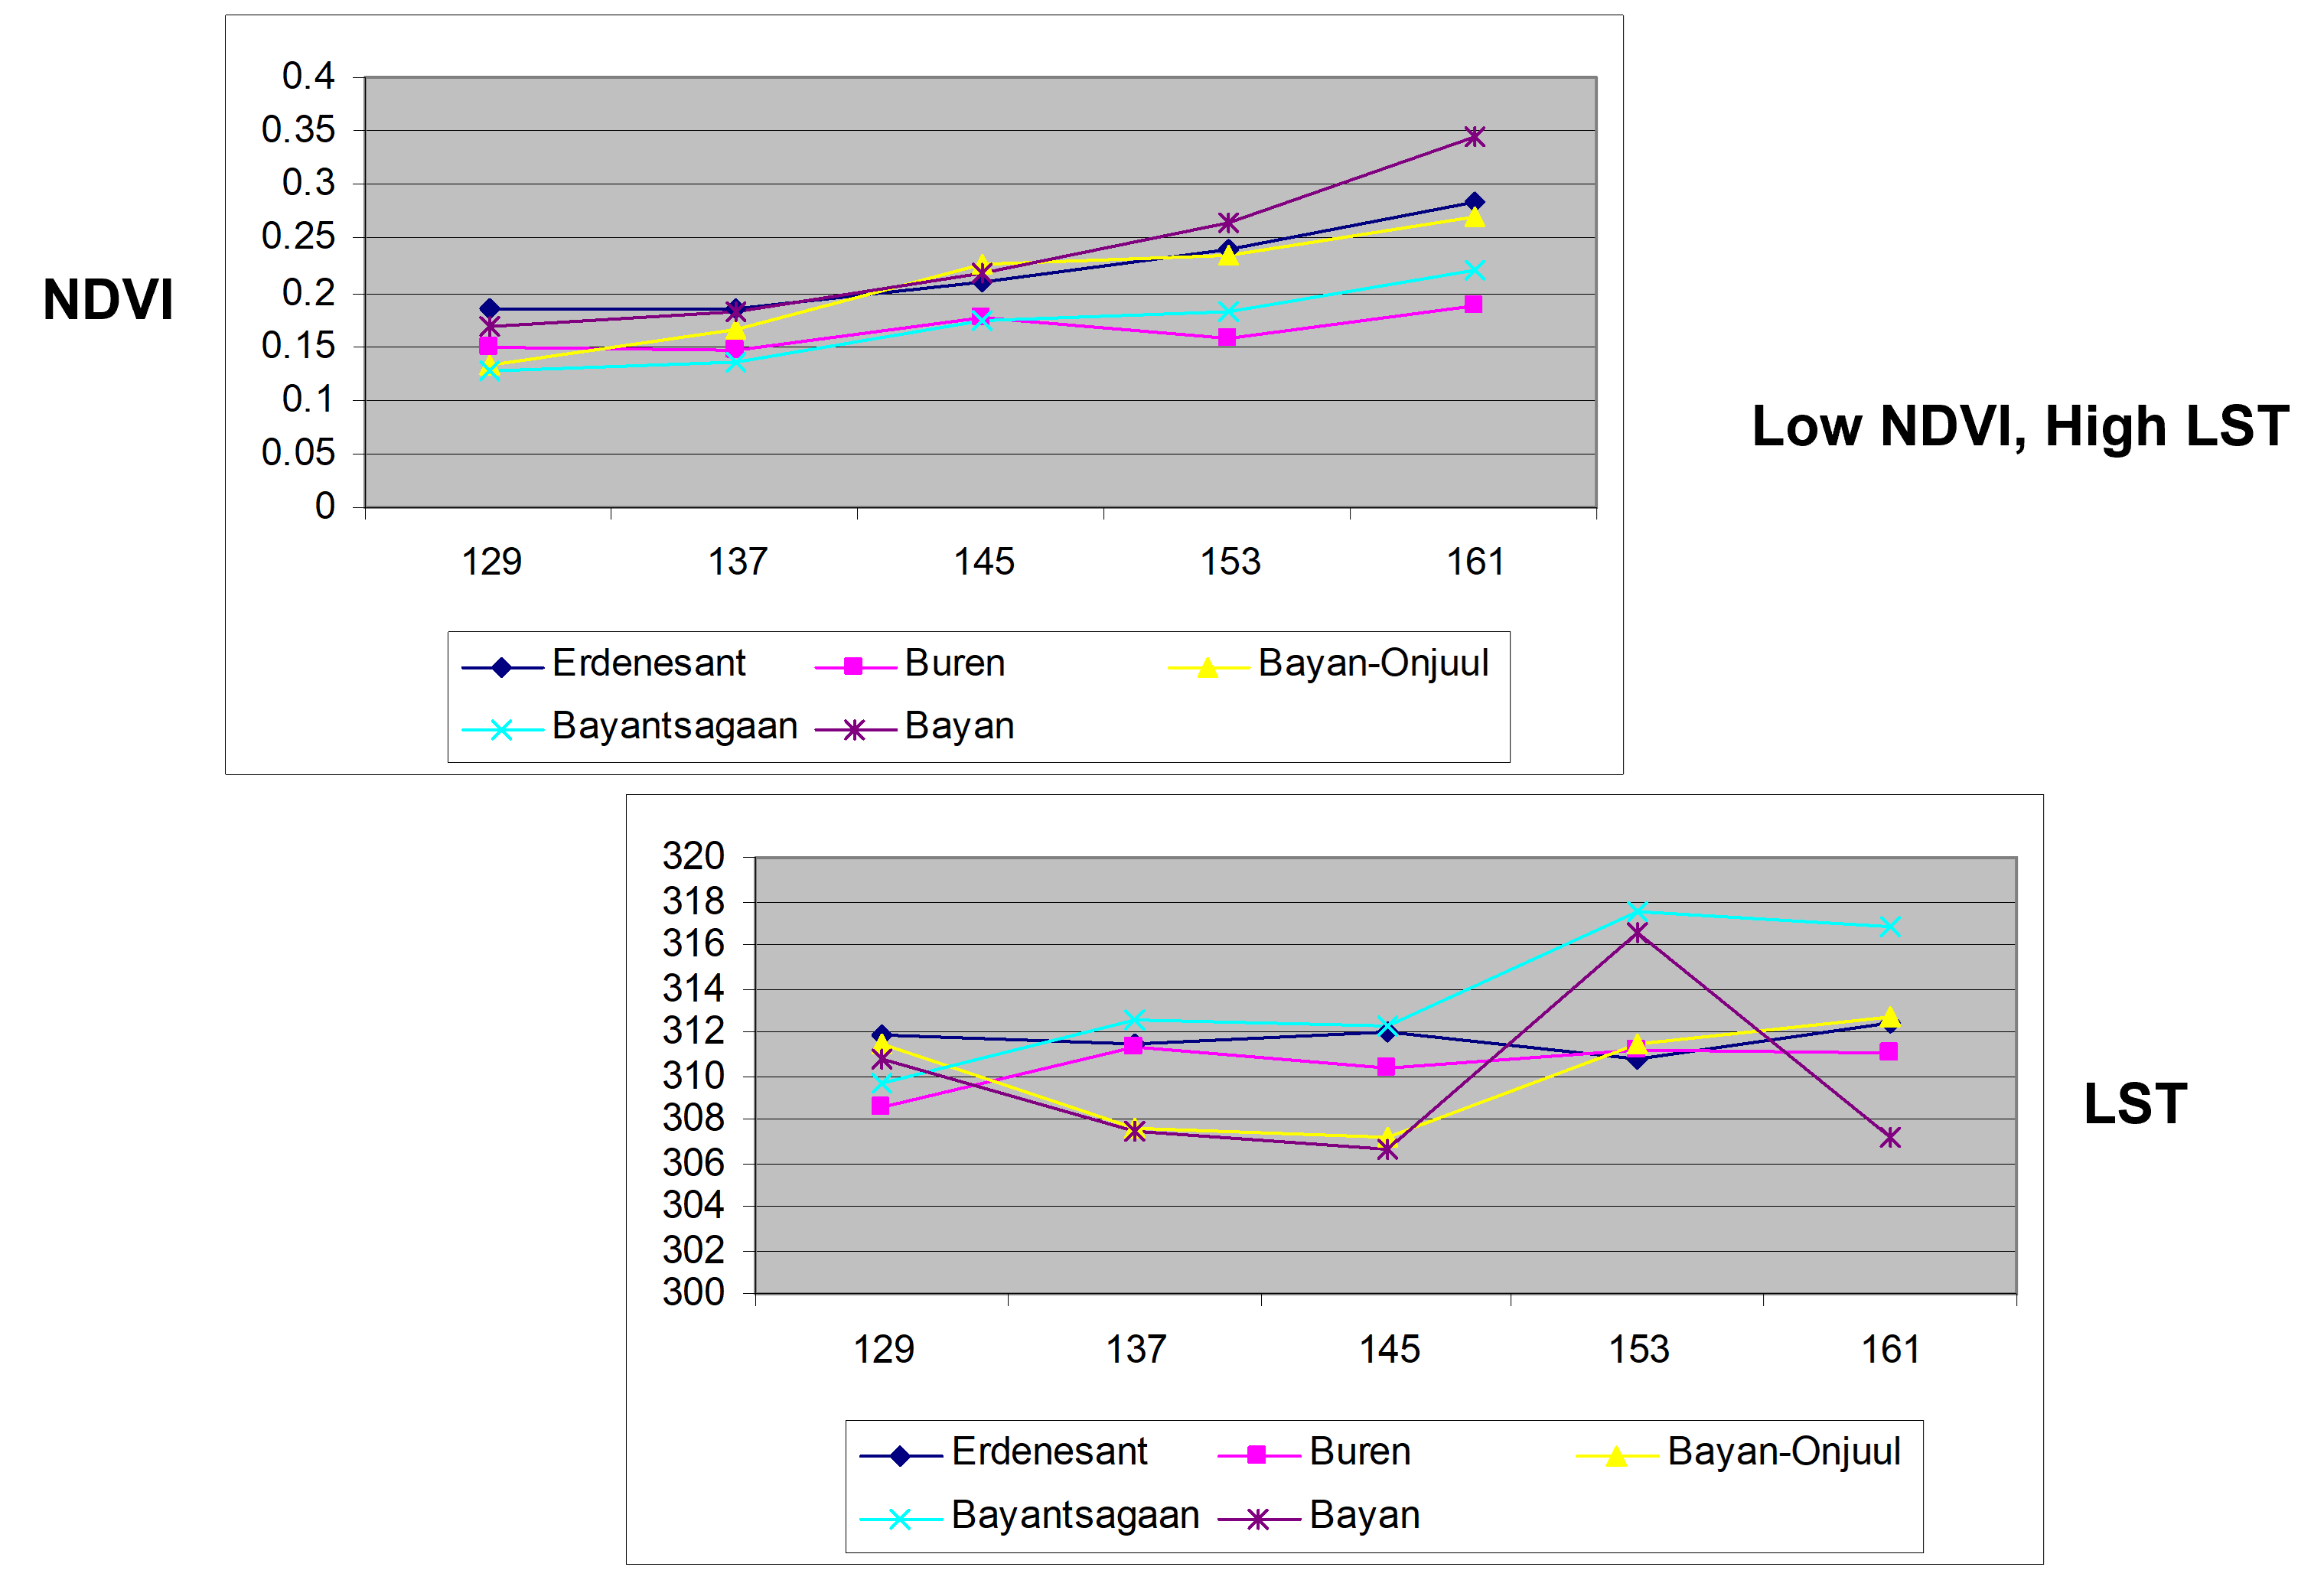
The final map was classified into 5 levels of dryness, as follows: very dry, dry, normal, wet, and very wet. SMI that falls into first and second level indicates drought, whereas the rest indicates no drought or favorable conditions. Based on this, in 2000 and 2008 there was no drought observed in the study area whilst in 2006 and 2007 western parts (Erdenesant and Buren soums) of the study area experienced severe droughts. In eastern part (Bayan and Bayantsagaan soums), drought appeared extremely in 2000 and 2008, but in 2006 and 2007 were the years without drought.
To examined the result, meteorological data from ground station such as rainfall and temperature were used. Relationship between LST and air temperature, LST and SMI, also SMI and rainfall were observed. Based on those relationship, it is clearly seen that SMI is more closely related to temperature. Thus, drought likely to occurs in high temperature and low moisture condition.
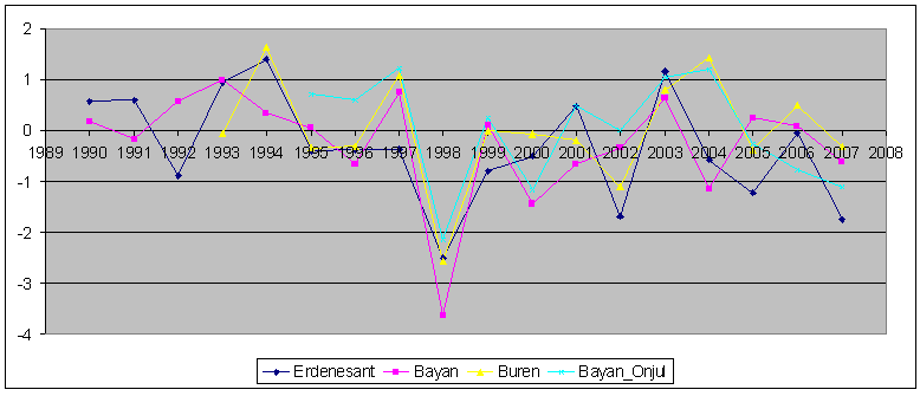
Another approach used to strengthen this study was based on meteorological data. Commonly used index, so called SPI (Standardized Precipitation Index) and PDSI (Palmer Drought Severity Index) were used. Total of five ground station present on the study area but only two station have a good long-term data. Based on PDSI, 2000, 2002-2005 and 2007 were dry years whereas 2001, 2006 were wet years according to the data gathered by Bayan station. SPI index shows the drought affected years, which is 1998, 2000, 2002 and 2007 whereas 2003 shows no drought. There is a difficulty to compare those meteorological index with SMI since different time scales were used. Short time scale in SMI (8-days composite) can not well represent on longer time scales used for SPI (monthly, 3monthly, 6 monthly) and PDSI (monthly), probably due to high temporal variability on meteorological condition in this region.
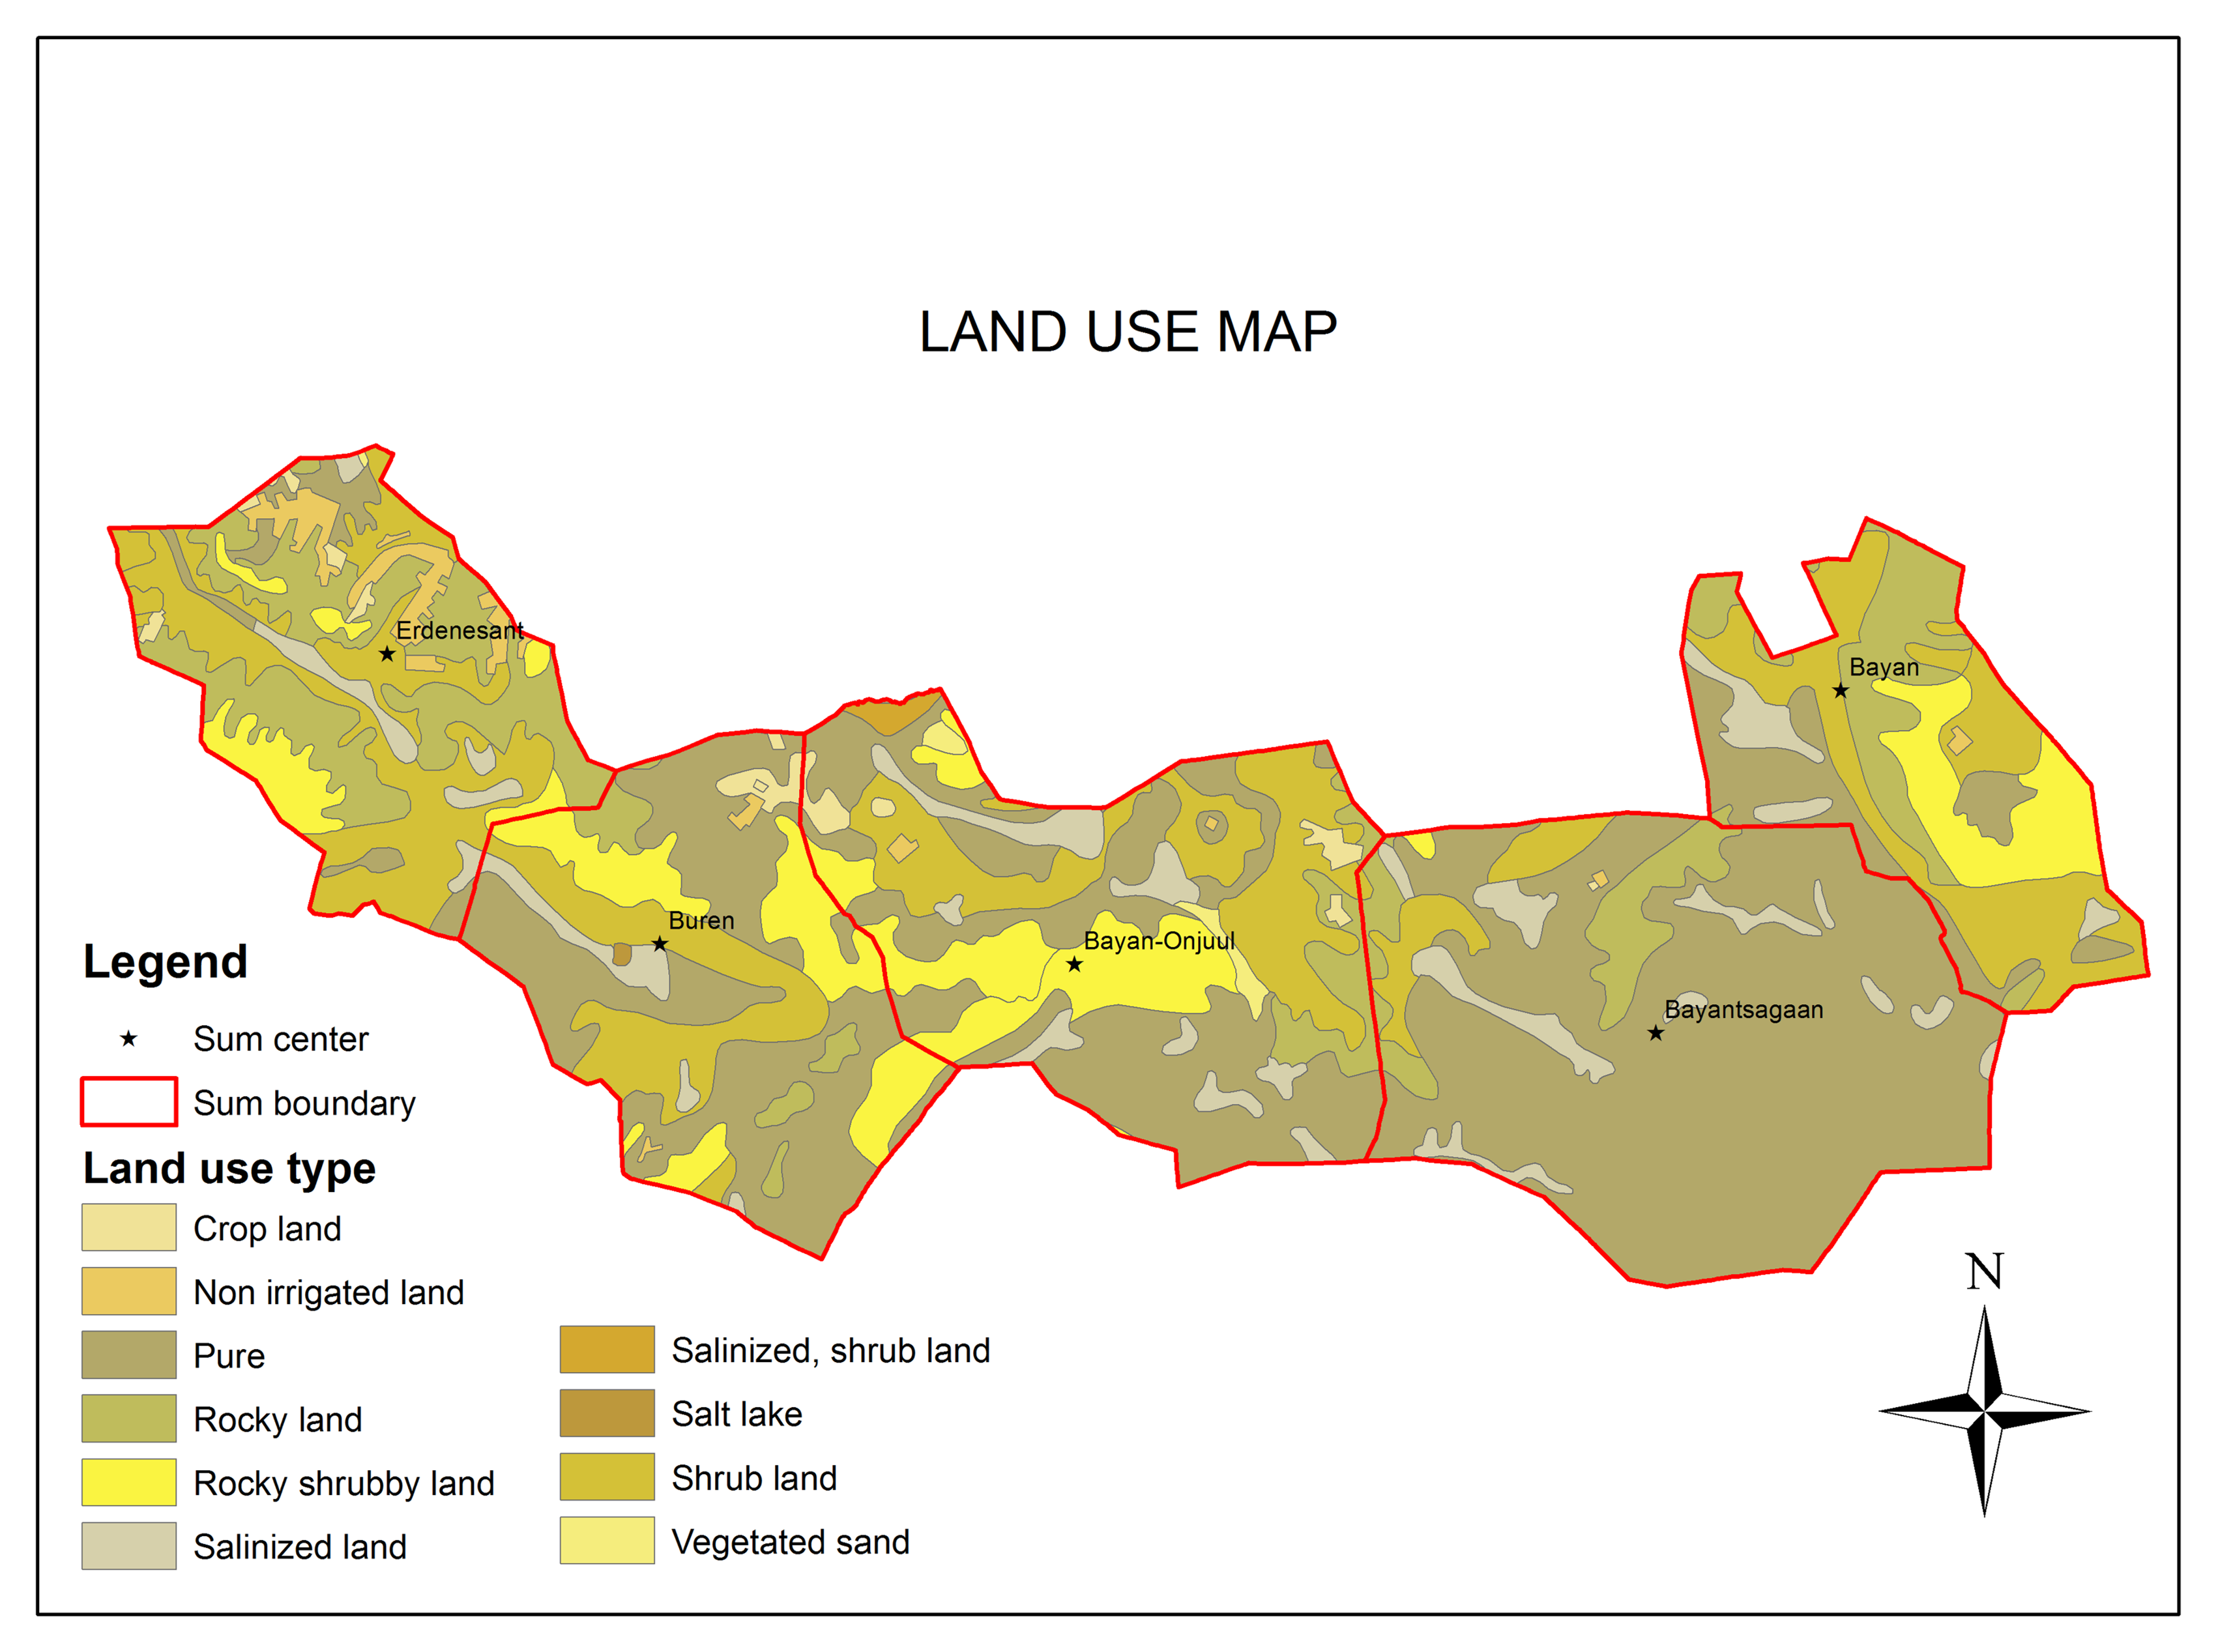
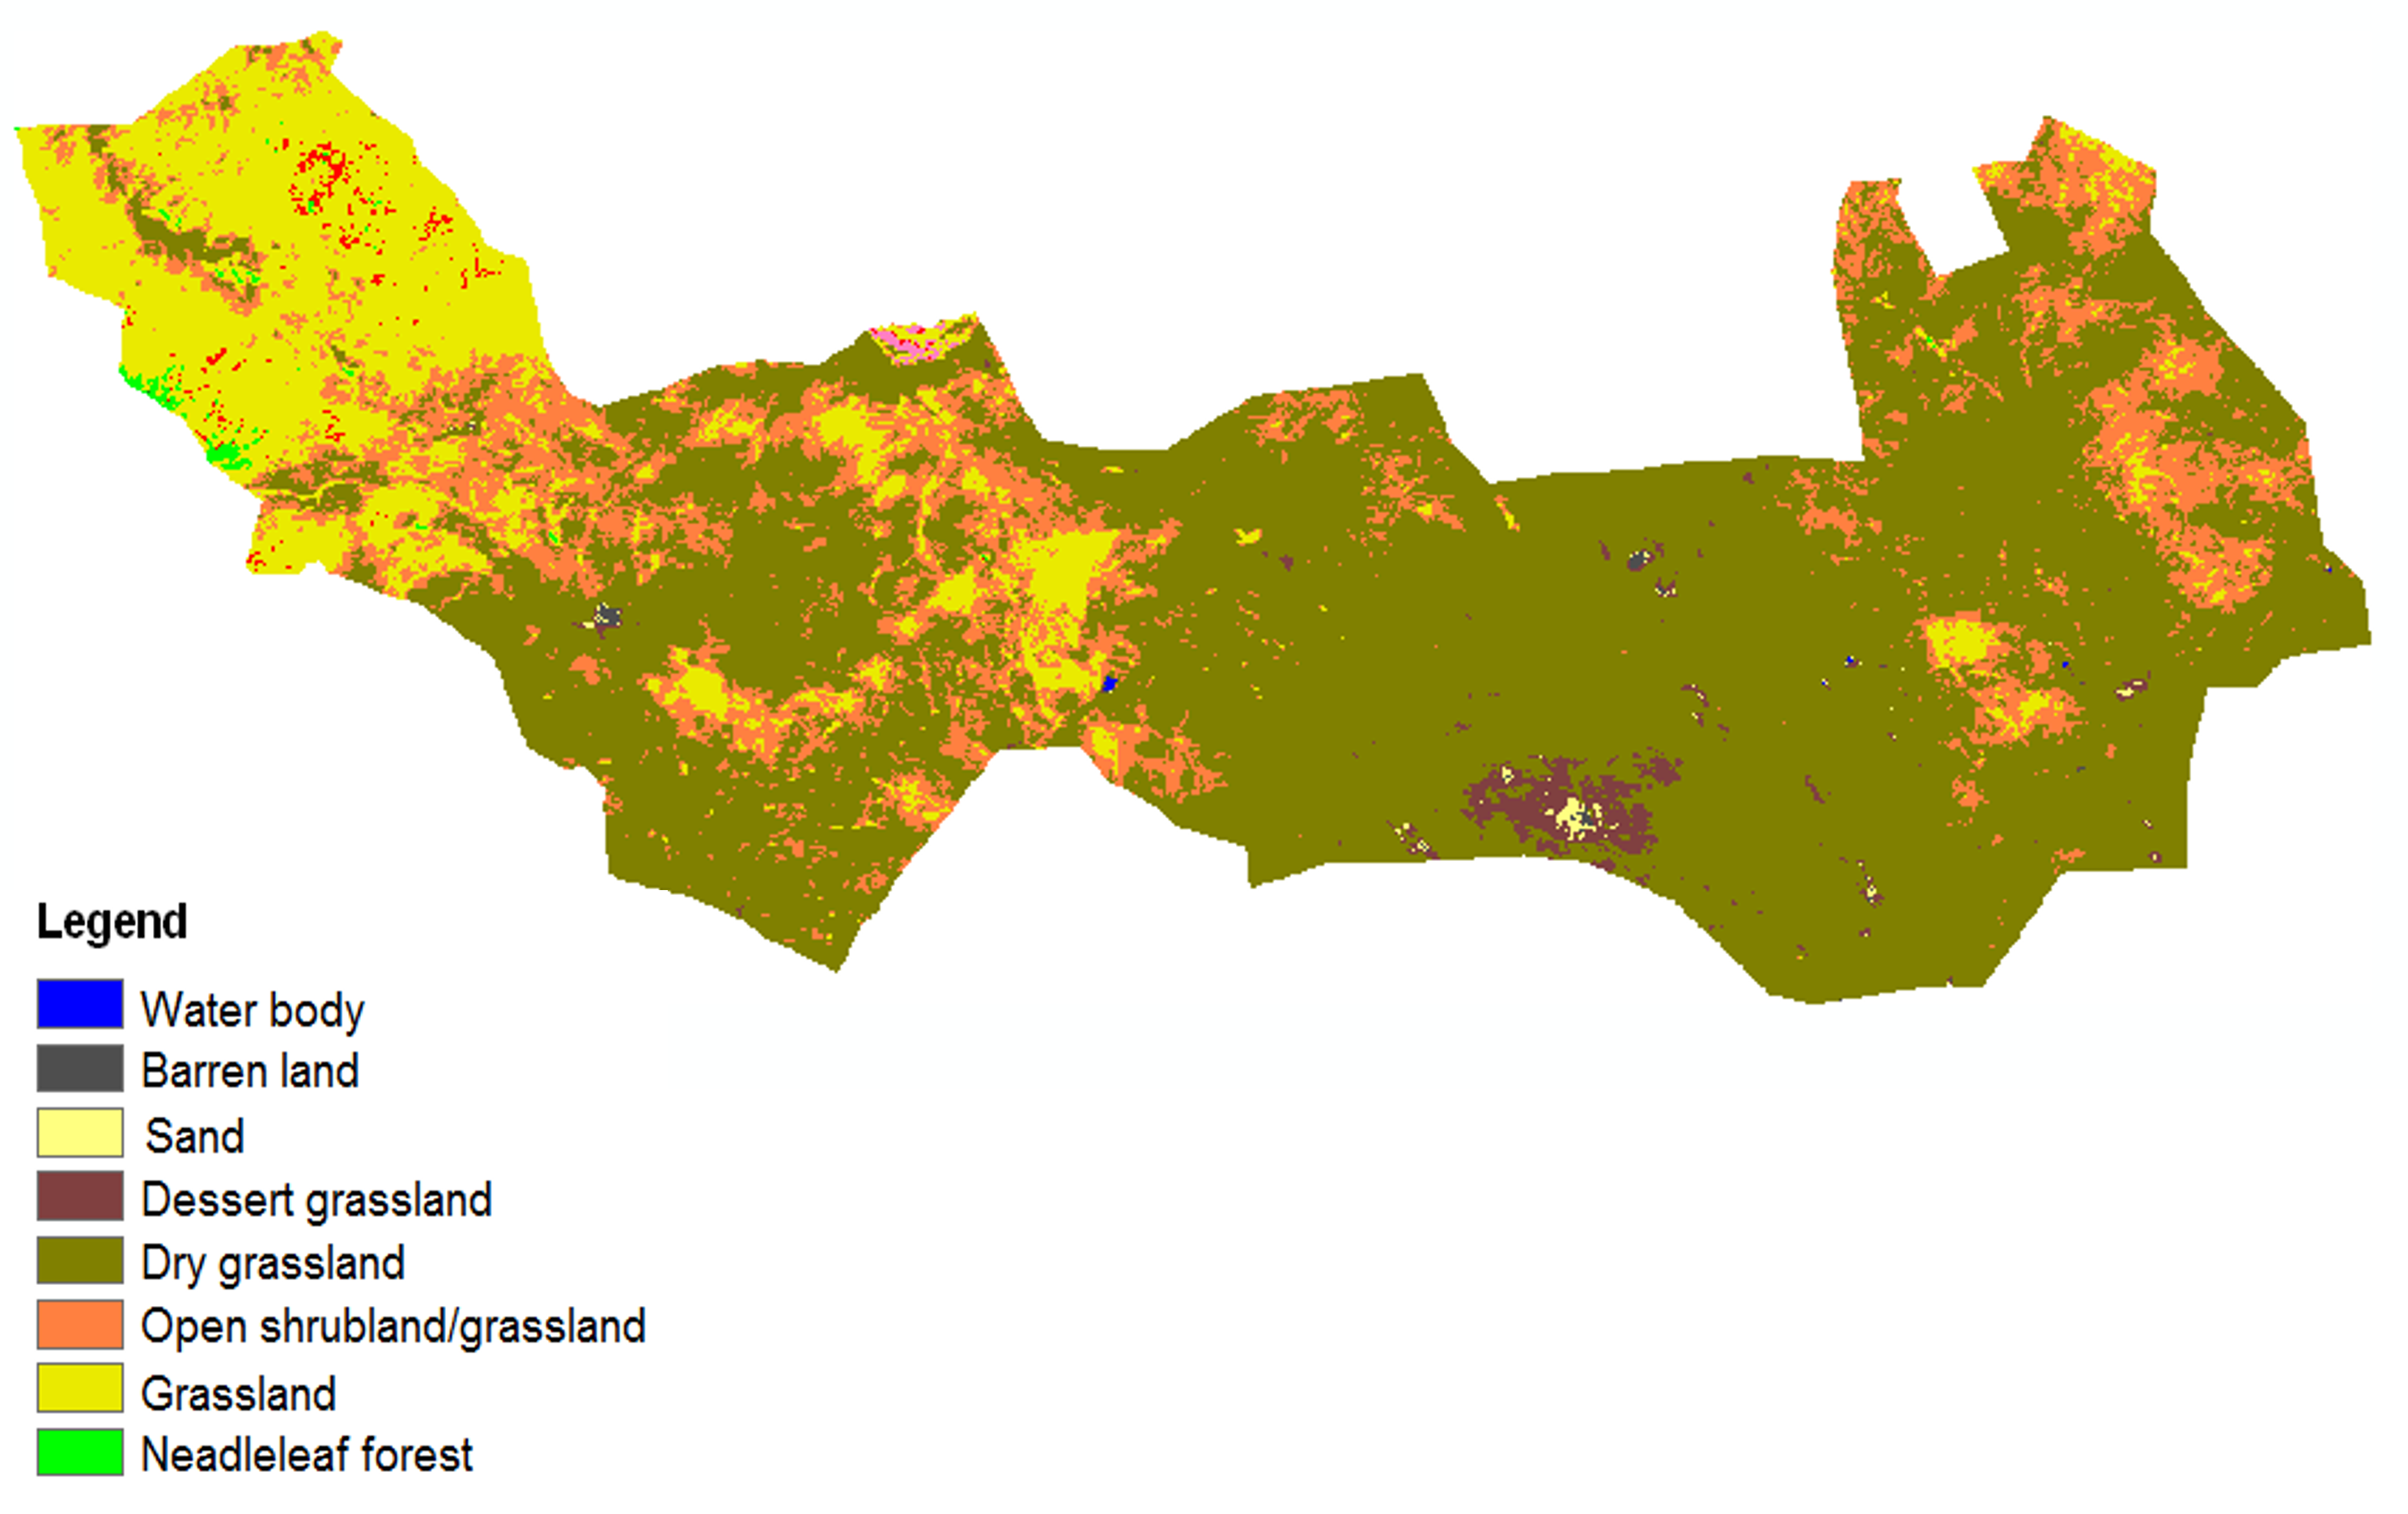
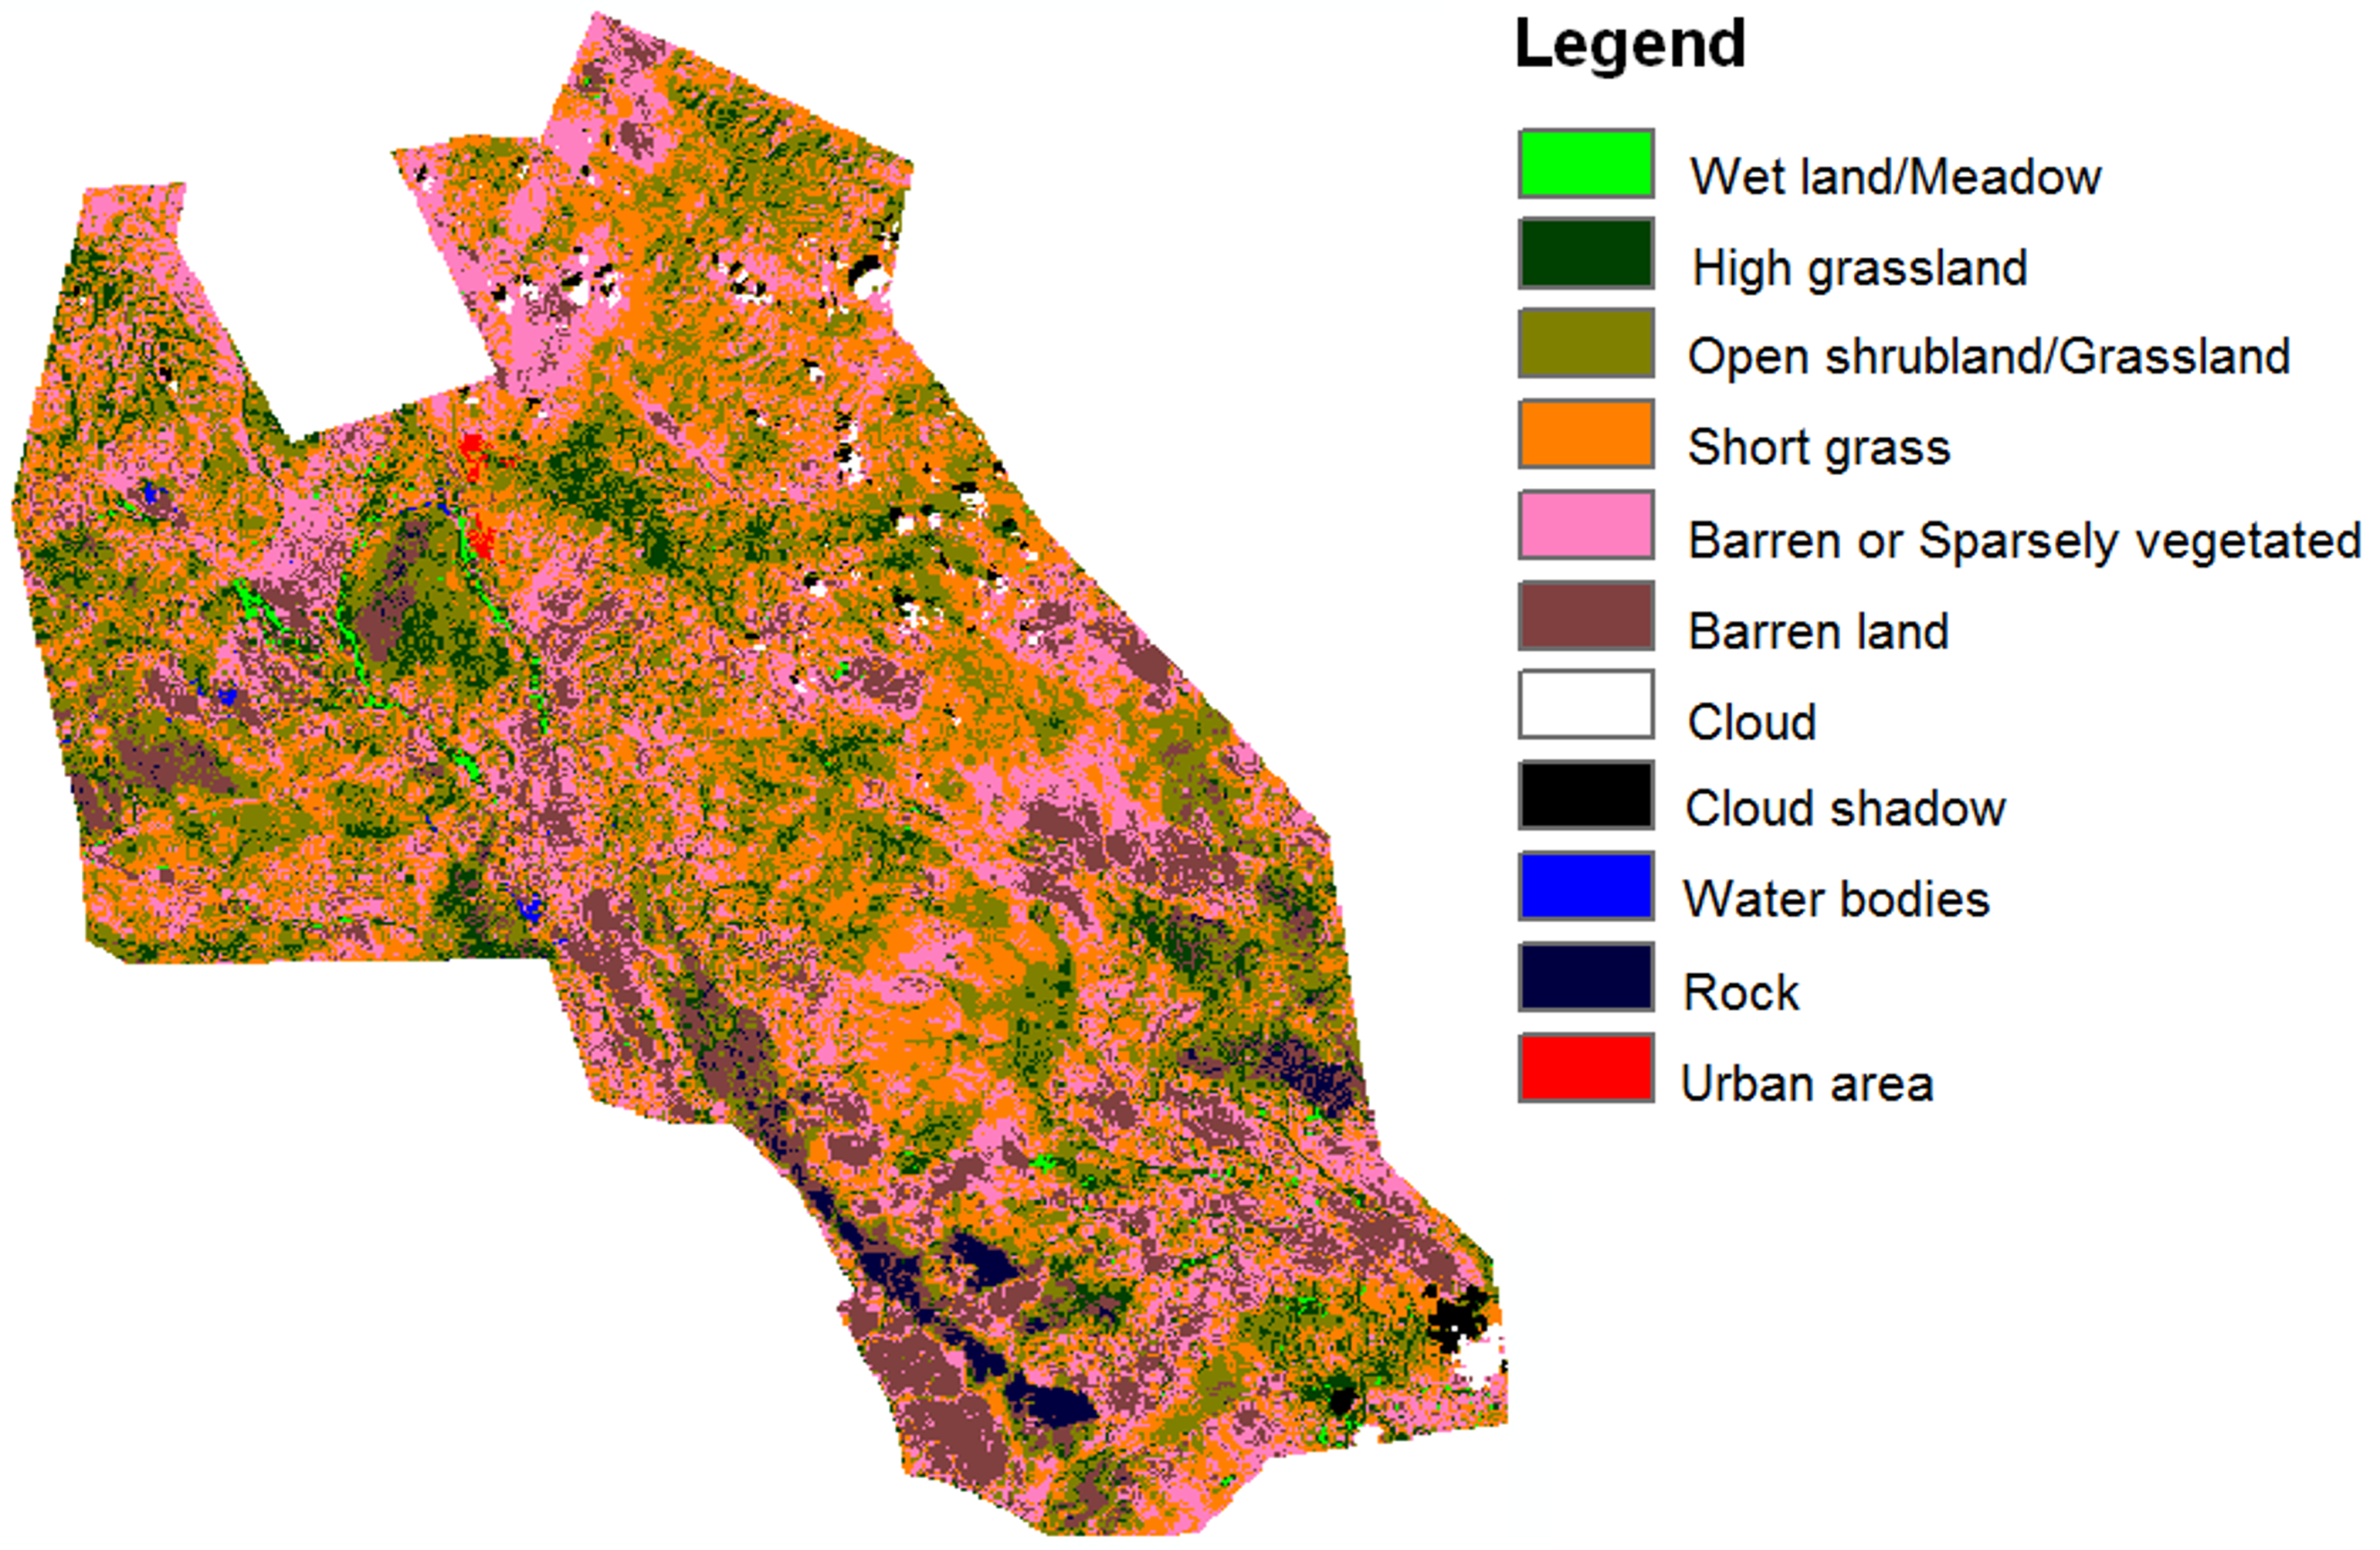
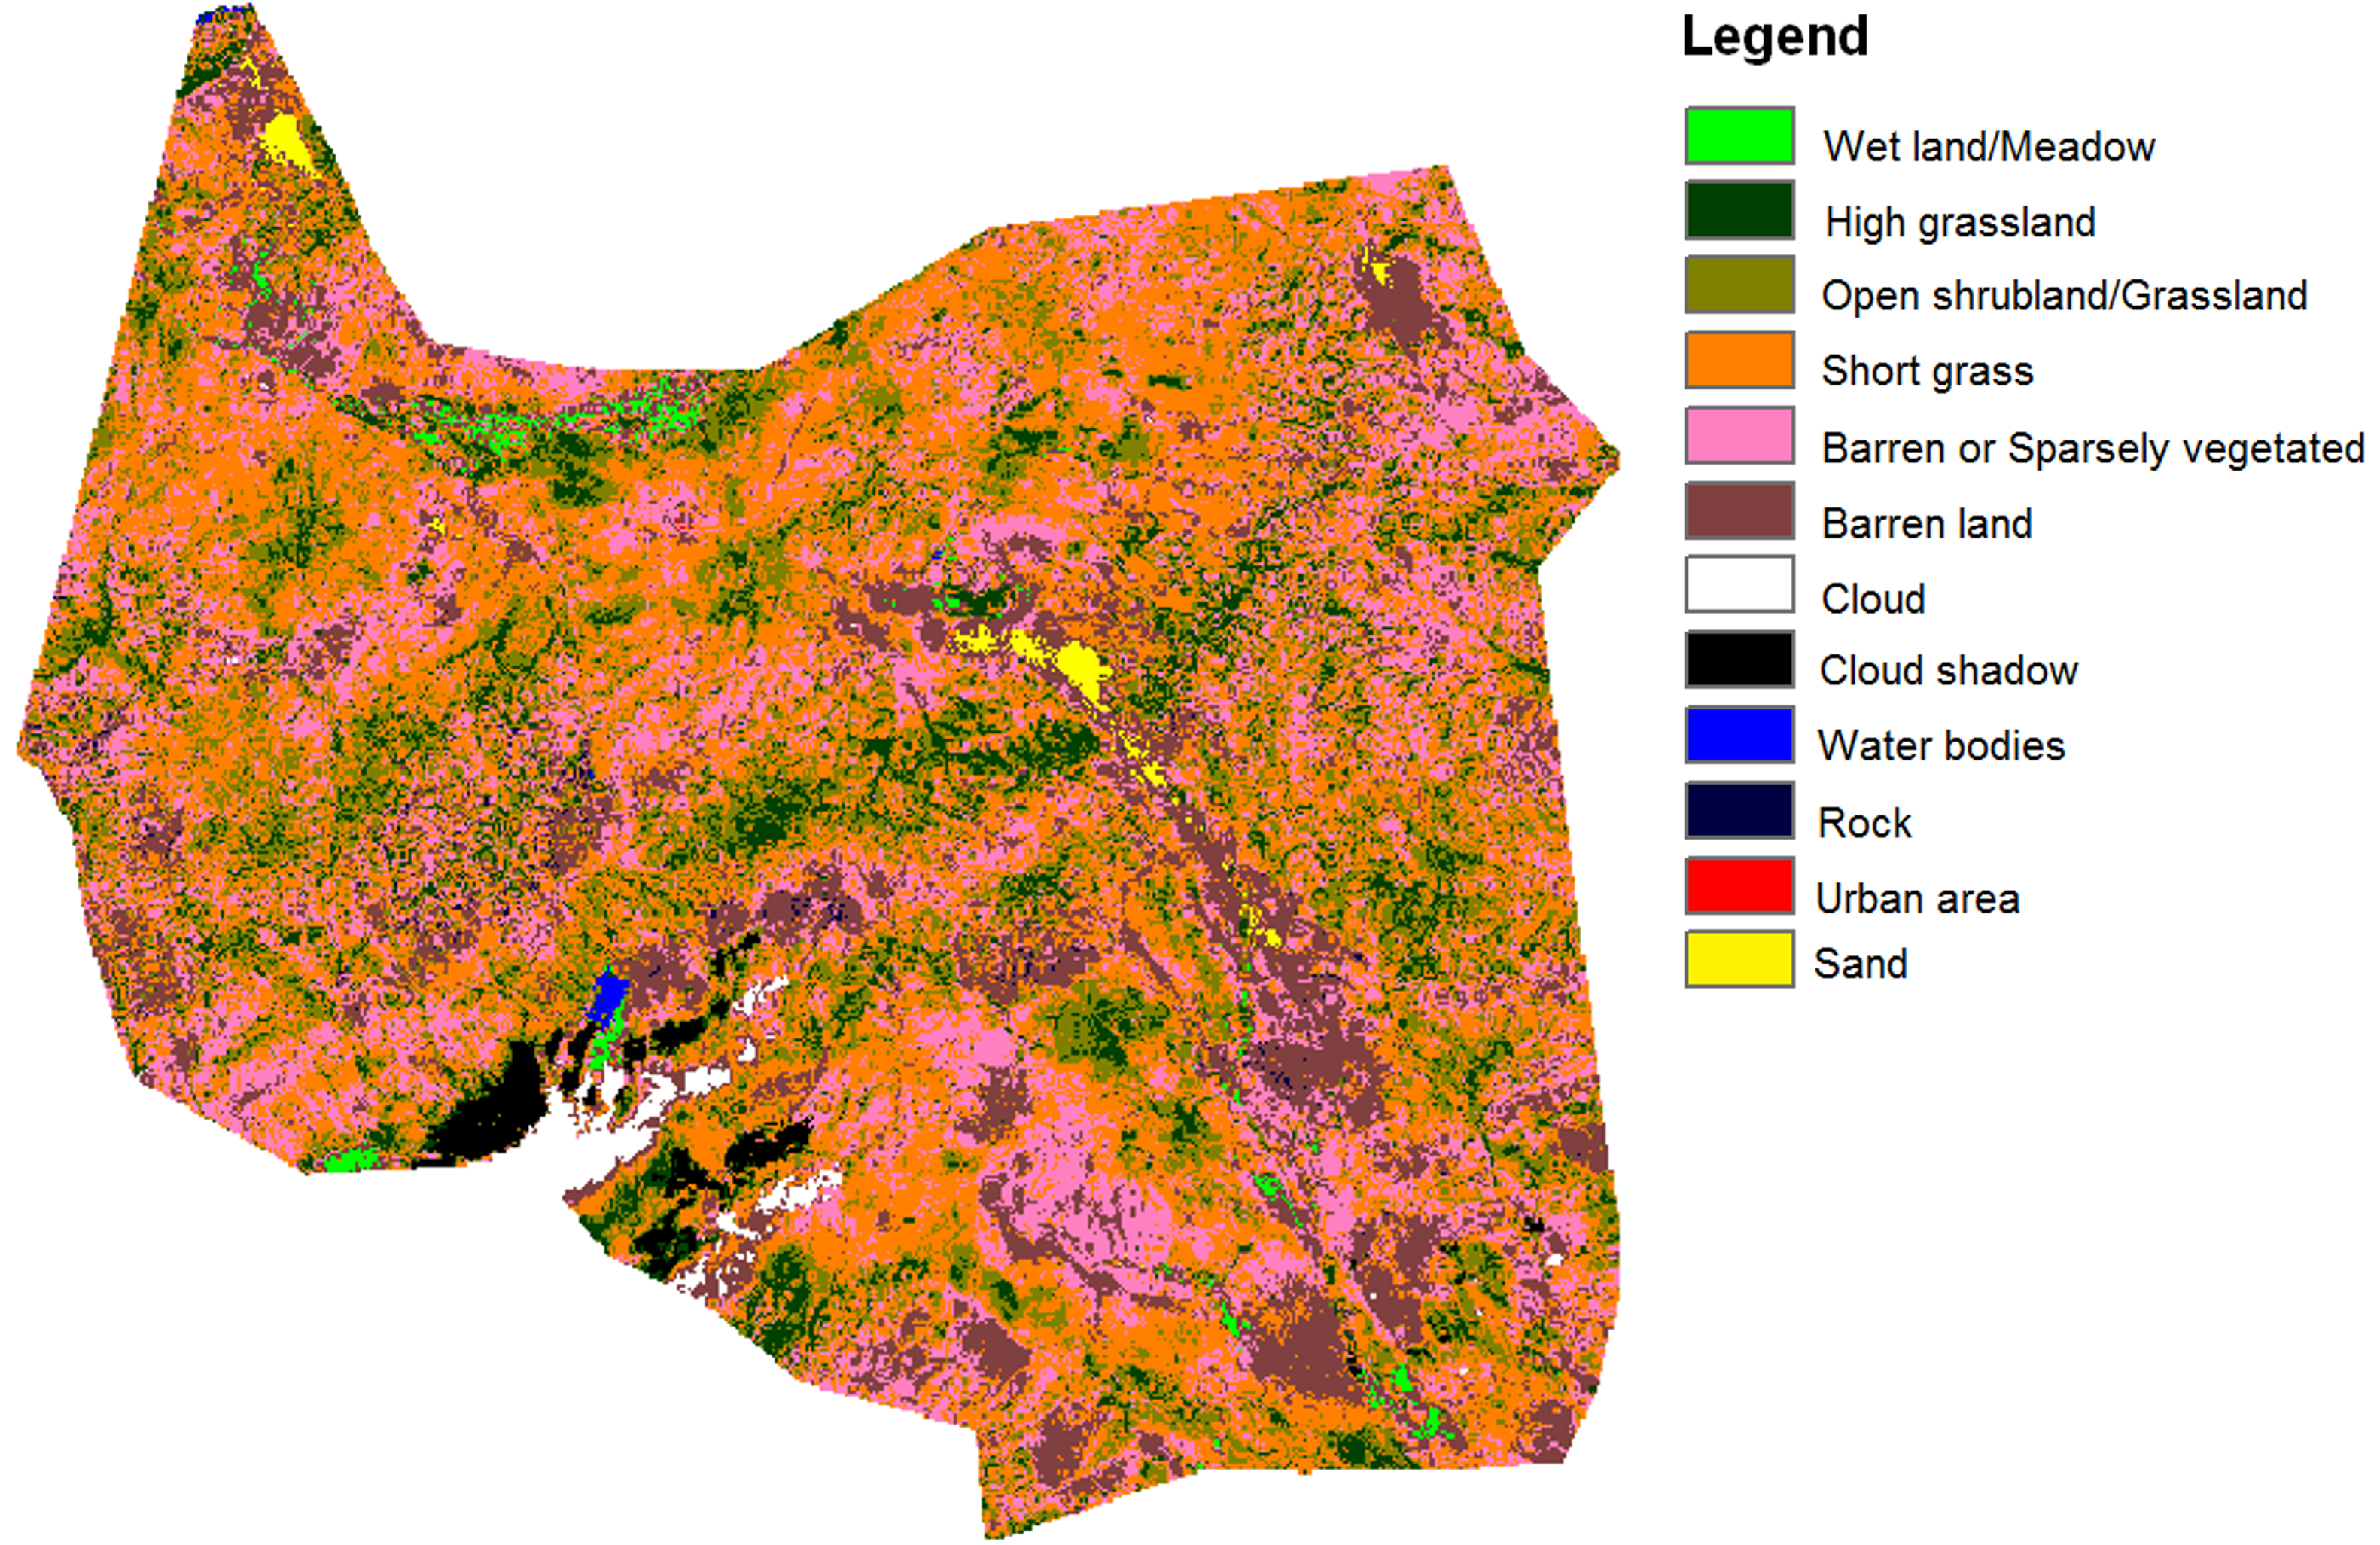
Land cover map of 2 soum in Tuv Aimag, Bayan and Bayan-Onjuul, was prepared from ALOS/AVNIR-2 image acquired on August 11th, 2008. It was classified into 12 classes from originally 30 classes of unsupervised classification referring to ground check and past land cover map. Detailed land cover classification map was obtained compare to existing land cover. The results showed that the study area which has been observed with from the remotely-sensed data could be mainly divided into 3 zones namely, grasslands, urban area and other area. The grassland areas were covered by High grassland, Open shrubland/grassland, Short grassland, and Barren or sparsely vegetated. Meadow area is found along the rivers that also became part of this category.