
Plastic and open environments – both are not suitable topics. But what if it happens? And it happens daily when you buy bubble tea or take away your favorite street food. Are you disposing of one of those?
In search of plastic waste, a prime convenience material since the early 20th century, has been disposed of to the environment. If it was not circulated, recycled, or disposed to open environment, plastics might still be in the environment since it was invented. Reducing the amount of plastic waste or managing its amount so it can be harmless to the environment requires all sectors. In spatial thinking, what can we do to approach an effort?
Here are the keywords that you will understand: monitoring and mapping.
Tracing plastics from the beginning
Plastic can be disposed of, where it might be from mismanagement or leakage. According to the legally binding options, leakage is plastic that enters the terrestrial and aquatic environment and is unintentionally disposed of.
From the term of leakage, we can assume where the monitoring needs to end. Leakage is supposed to be traced down from intentional disposal or the waste generated in the first place.
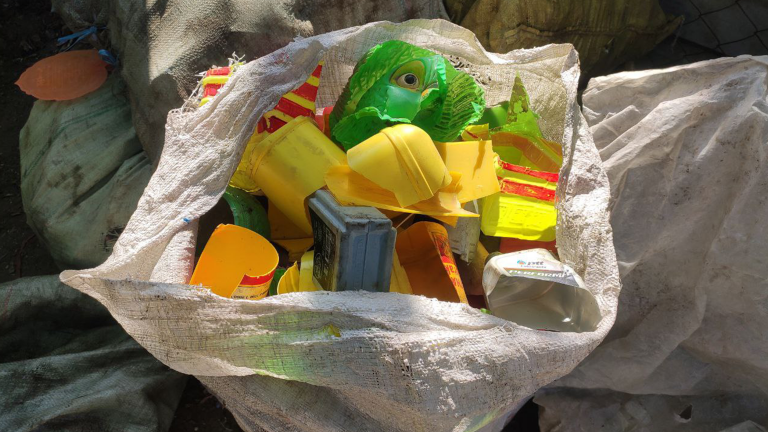
Initially, a study published in Nature (2022) implored that plastic that cannot be recycled is one of the significant sources of adjacent leakage. Looking at the source of how it cannot be recycled, plastic is found to be unable to be recycled in the first place or become unrecyclable due to contaminants.
Added to where plastic might end up, a study published by Wiley (2020) indicated river becomes a crucial place where it can transfer plastic waste. However, the source itself will always be from the land.
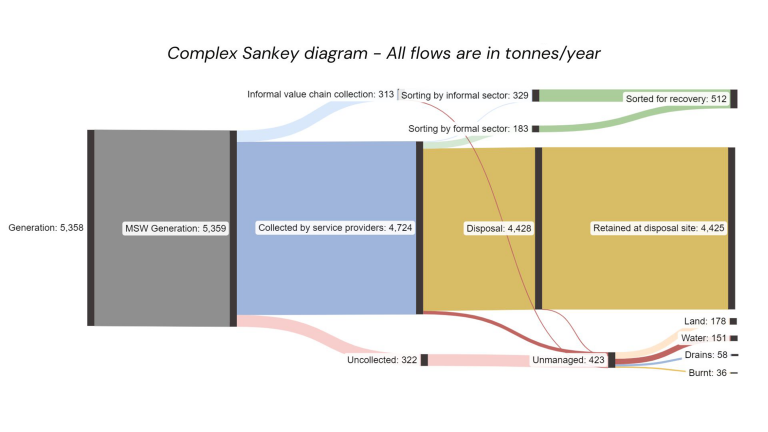
Combining all the concepts of where plastic becomes leaked and where it might end up (fate), a tool developed called Waste Flow Diagram (developed by the University of Leeds, GIZ, EAWAG) combines the concepts and summaries the factors that can turn the data into plastic leakage in a ton from the whole system of waste management. Since the summarizing concepts are also based on the actual data, a prominent tool may give a hand.
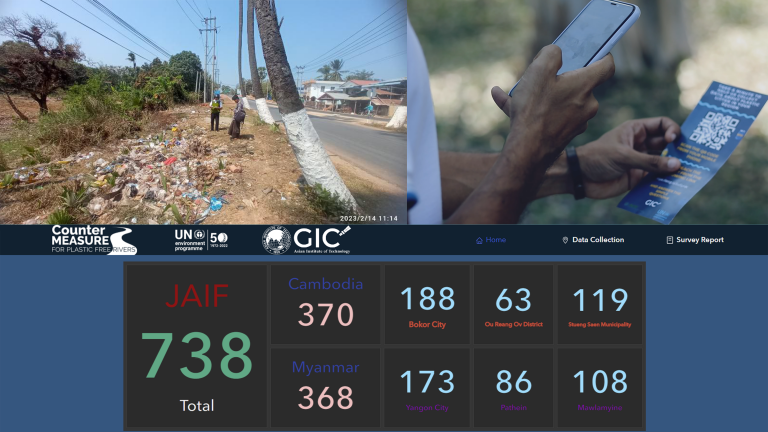
In robust digital innovation and the wide usage of mobile phones, the GIC team introduced a mobile app for the macroplastic survey to trace where plastic ends up. We summarized it into different places: littering spots – areas of plastic accumulated on the roadside; artificial barriers – locations that interfere with bridges and riverbanks; and uncontrol dump – unusual areas and unofficial areas for dumping waste. Collect the data using a phone, and all the sites are recorded.
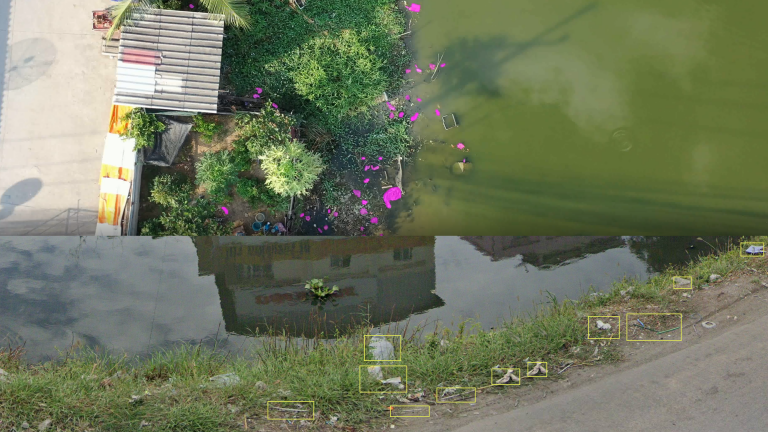
What if there is a lot of area of plastic found and unreachable by only capturing from a mobile phone? To answer this, we conclude a smart tool called pLitter, an AI-based algorithm to detect plastics. We have installed it on vehicle-mounted cameras, CCTV, and drones.
Identify the area of plastic waste
It might be a soundboard for identifying where plastic may be leaked, tossed in the environment, and clogged the systems with its sequential accumulation. According to the technology mentioned earlier, how can it be a conclusion of all plastic findings?
The answer is a hotspot map!
How is the hotspot map defined? Not only gathering all the findings in data collection, but the hotspot map is also intercorrelated with the surrounding condition. Here, we applied the spatial thinking principle to a piece of information.
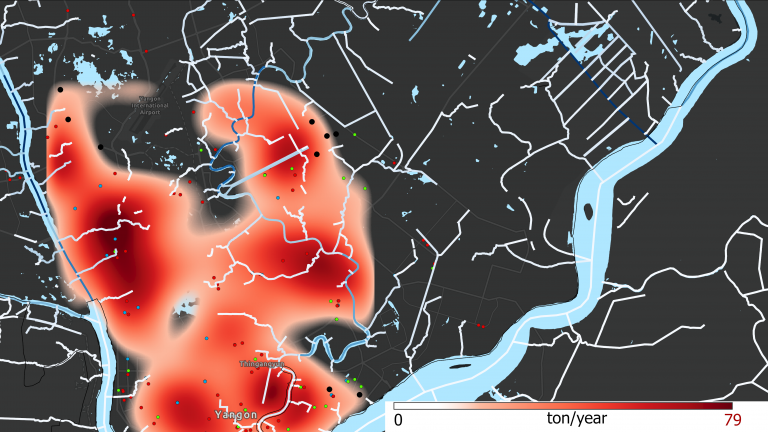
In interpreting the results, the map can show which area, rivers, canals, and zones plastic waste exacerbates. The map identifies one package of monitoring in plastic, where it needs more attention, where the area needs to be incentivized, and where to get an immediate response.
In Respond to INC-2, how action plan in each country can be harmonized?
In trace to the upcoming high panel meeting on the INC-2 for plastic waste treaty being legally binding, where countries all over the world must agree upon plastic consumption, a word of national action plans are prominent for delegates to be compiled of. The effectiveness of National Action Plans (NAPs) is required to be emphasized.
Gaps were found where the repetition of data is not updated along with the NAPs implementation. Therefore, the solutions can be offered by simply monitoring consistency through the mapping methods. The consistency of the data collection, harmonizing the monitoring brings the crucial baseline for increasing the effectiveness of the action.
Final thoughts: the map can comply with the existing plastic and reduce environmental harm. In the next step, the plastic waste generation tap must be closed with other stakeholders collaborating.
Related Links:
- https://plitter.org/home
- https://plasticpollution.leeds.ac.uk/home/toolkits/wfd/
- Rinasti, A. N., Ibrahim, I. F., Gunasekara, K., Koottatep, T., & Winijkul, E. (2022). Fate identification and management strategies of non-recyclable plastic waste through the integration of material flow analysis and leakage hotspot modeling. Scientific Reports, 12(1), 1-14. https://doi.org/10.1038/s41598-022-20594-w
- Schwarz, A. (2020). Plastic debris in rivers. Wiley Interdisciplinary Reviews: Water, 7(1), e1398. https://doi.org/10.1002/wat2.1398